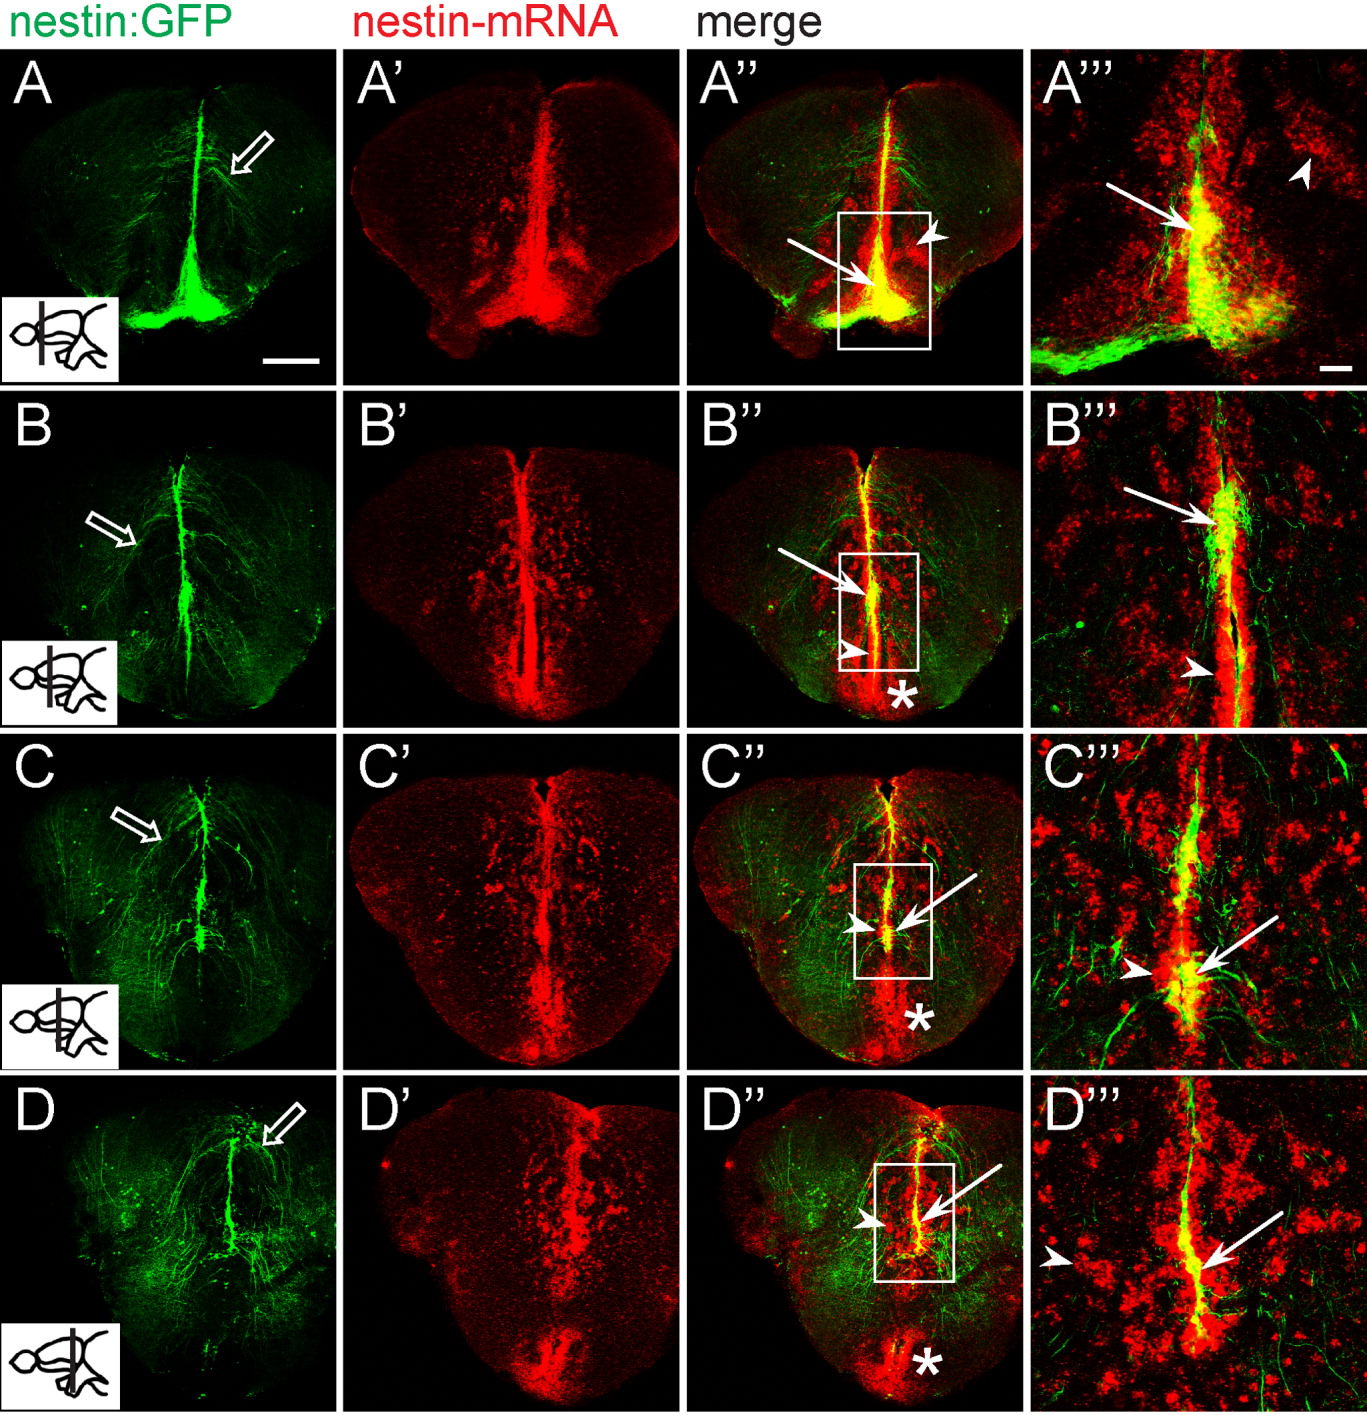
Fig. 2 Comparison of tg[-3.9nestin:GFP] expression with endogenous nestin mRNA. Transverse sections were processed for fluorescence in situ hybridization with nestin riboprobe followed by immunohistochemical detection with an anti-green fluorescent protein (GFP) antibody. A-D: Expression of tg[-3.9nestin:GFP] from the anterior to posterior levels of the telencephalon. Inset indicates the plane of section. GFP-labeled processes are reminiscent of radial glial fibers (open arrows). A′-D′: In situ hybridizations on sections shown in A-D with antisense nestin. A″-D″: Colocalization of GFP and nestin mRNA at the ventricular zones (arrows). Certain subventricular areas (arrowheads) express the endogenous nestin mRNA but not the transgene, including a large domain in the ventral telencephalon (asterisks in B″, C″) and in the diencephalic ventricle (asterisk in D″). A′-D′″: Higher magnification of boxed regions in A″-D″. The nestin-expressing cells include those in the ventricular zone (VZ) and in scattered cells of the parenchyma, while GFP-expressing cells with glia-like projections emanate from the VZ. Most of the GFP-expressing cells colocalized with nestin. Images are confocal single optical sections. Scale bars = 100 μm in A, 50 μm in A′″.
Image
Figure Caption
Figure Data
Acknowledgments
This image is the copyrighted work of the attributed author or publisher, and
ZFIN has permission only to display this image to its users.
Additional permissions should be obtained from the applicable author or publisher of the image.
Full text @ Dev. Dyn.

