
|
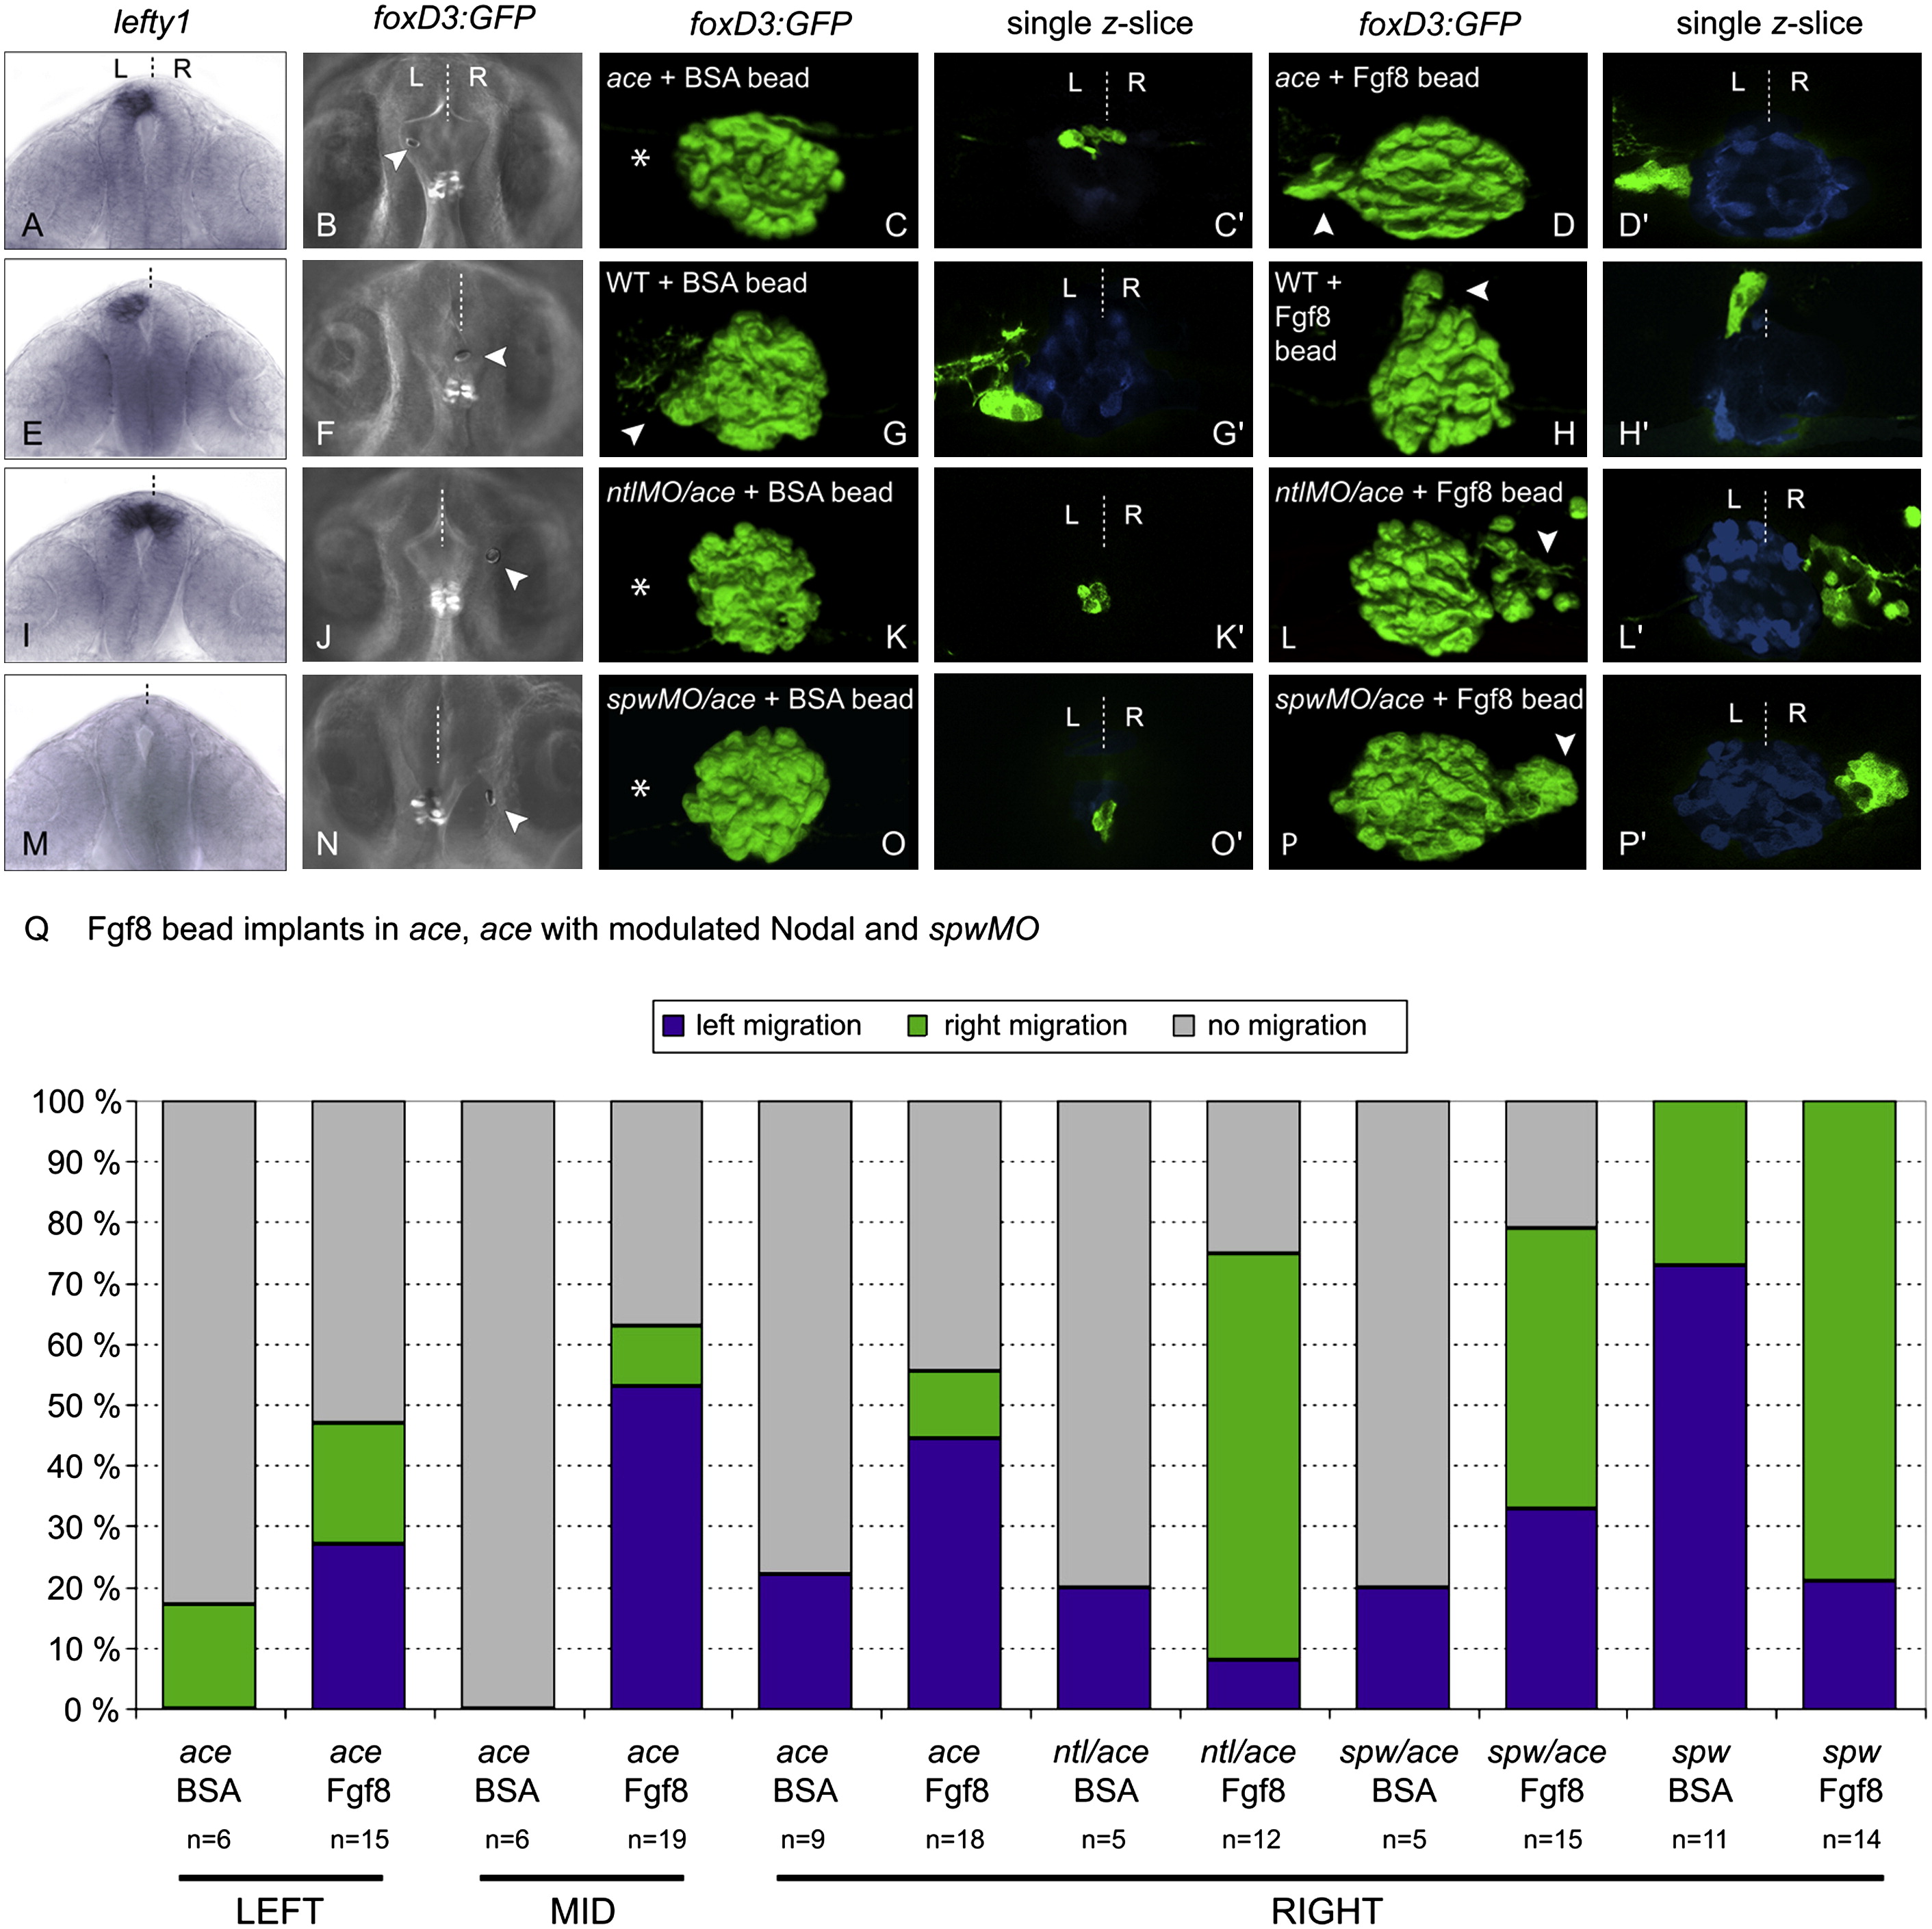
Fig. 3 Local Provision of Fgf8 Restores Parapineal Migration in ace Embryos and Directs Laterality of Migration in the Absence of a Nodal Signaling Bias
(A, E, I, and M) Frontal views of lefty1 expression (as a marker of Nodal signaling) in ace (A), wild-type (E), ntlMO/ace (I), and spawMO/ace (M) embryos at 20 hpf, with dorsal to the top. (B, F, J, and N) dorsal views of live brains showing Fgf8-soaked beads implanted rostrally and to the left (B), right (J and N), and midline (F) of the pineal complex visualized by Tg(foxD3:GFP) expression, in ace (B), wild-type (F), ntlMO/ace (J), and spawMO/ace (N) embryos. Anterior is to the top. (C, C′, D, D′, G, G′, H, H′, K, K′, L, L′, O, O′, P, and P′) 3D reconstructions and single z-slices of dorsal views of the epithalamus in ace (C–D′), wild-type (G–H′), ntlMO/ace 1(K–L′), and spawMO/ace (O–P′) Tg(foxD3:GFP) embryos at 3 dpf implanted with BSA- (C, C′, G, G′, K, K′, O, and O′) or Fgf8- (D, D′, H, H′, L, L′, P, and P′) loaded beads. Pineal/parapineal complex (green) is visualized as before. Pineal cells have been pseudocolored in blue in single z-slices. Anterior is to the top. (Q) Graph representing proportions of embryos with right (green), left (blue), or static (gray) parapineal nuclei after epithalamic implantation of BSA- and Fgf8-loaded beads in ace embryos, ace embryos with modulated Nodal, and spawMO embryos. Results are grouped according to position (left, middle, or right) of bead implantation.