Fig. 3
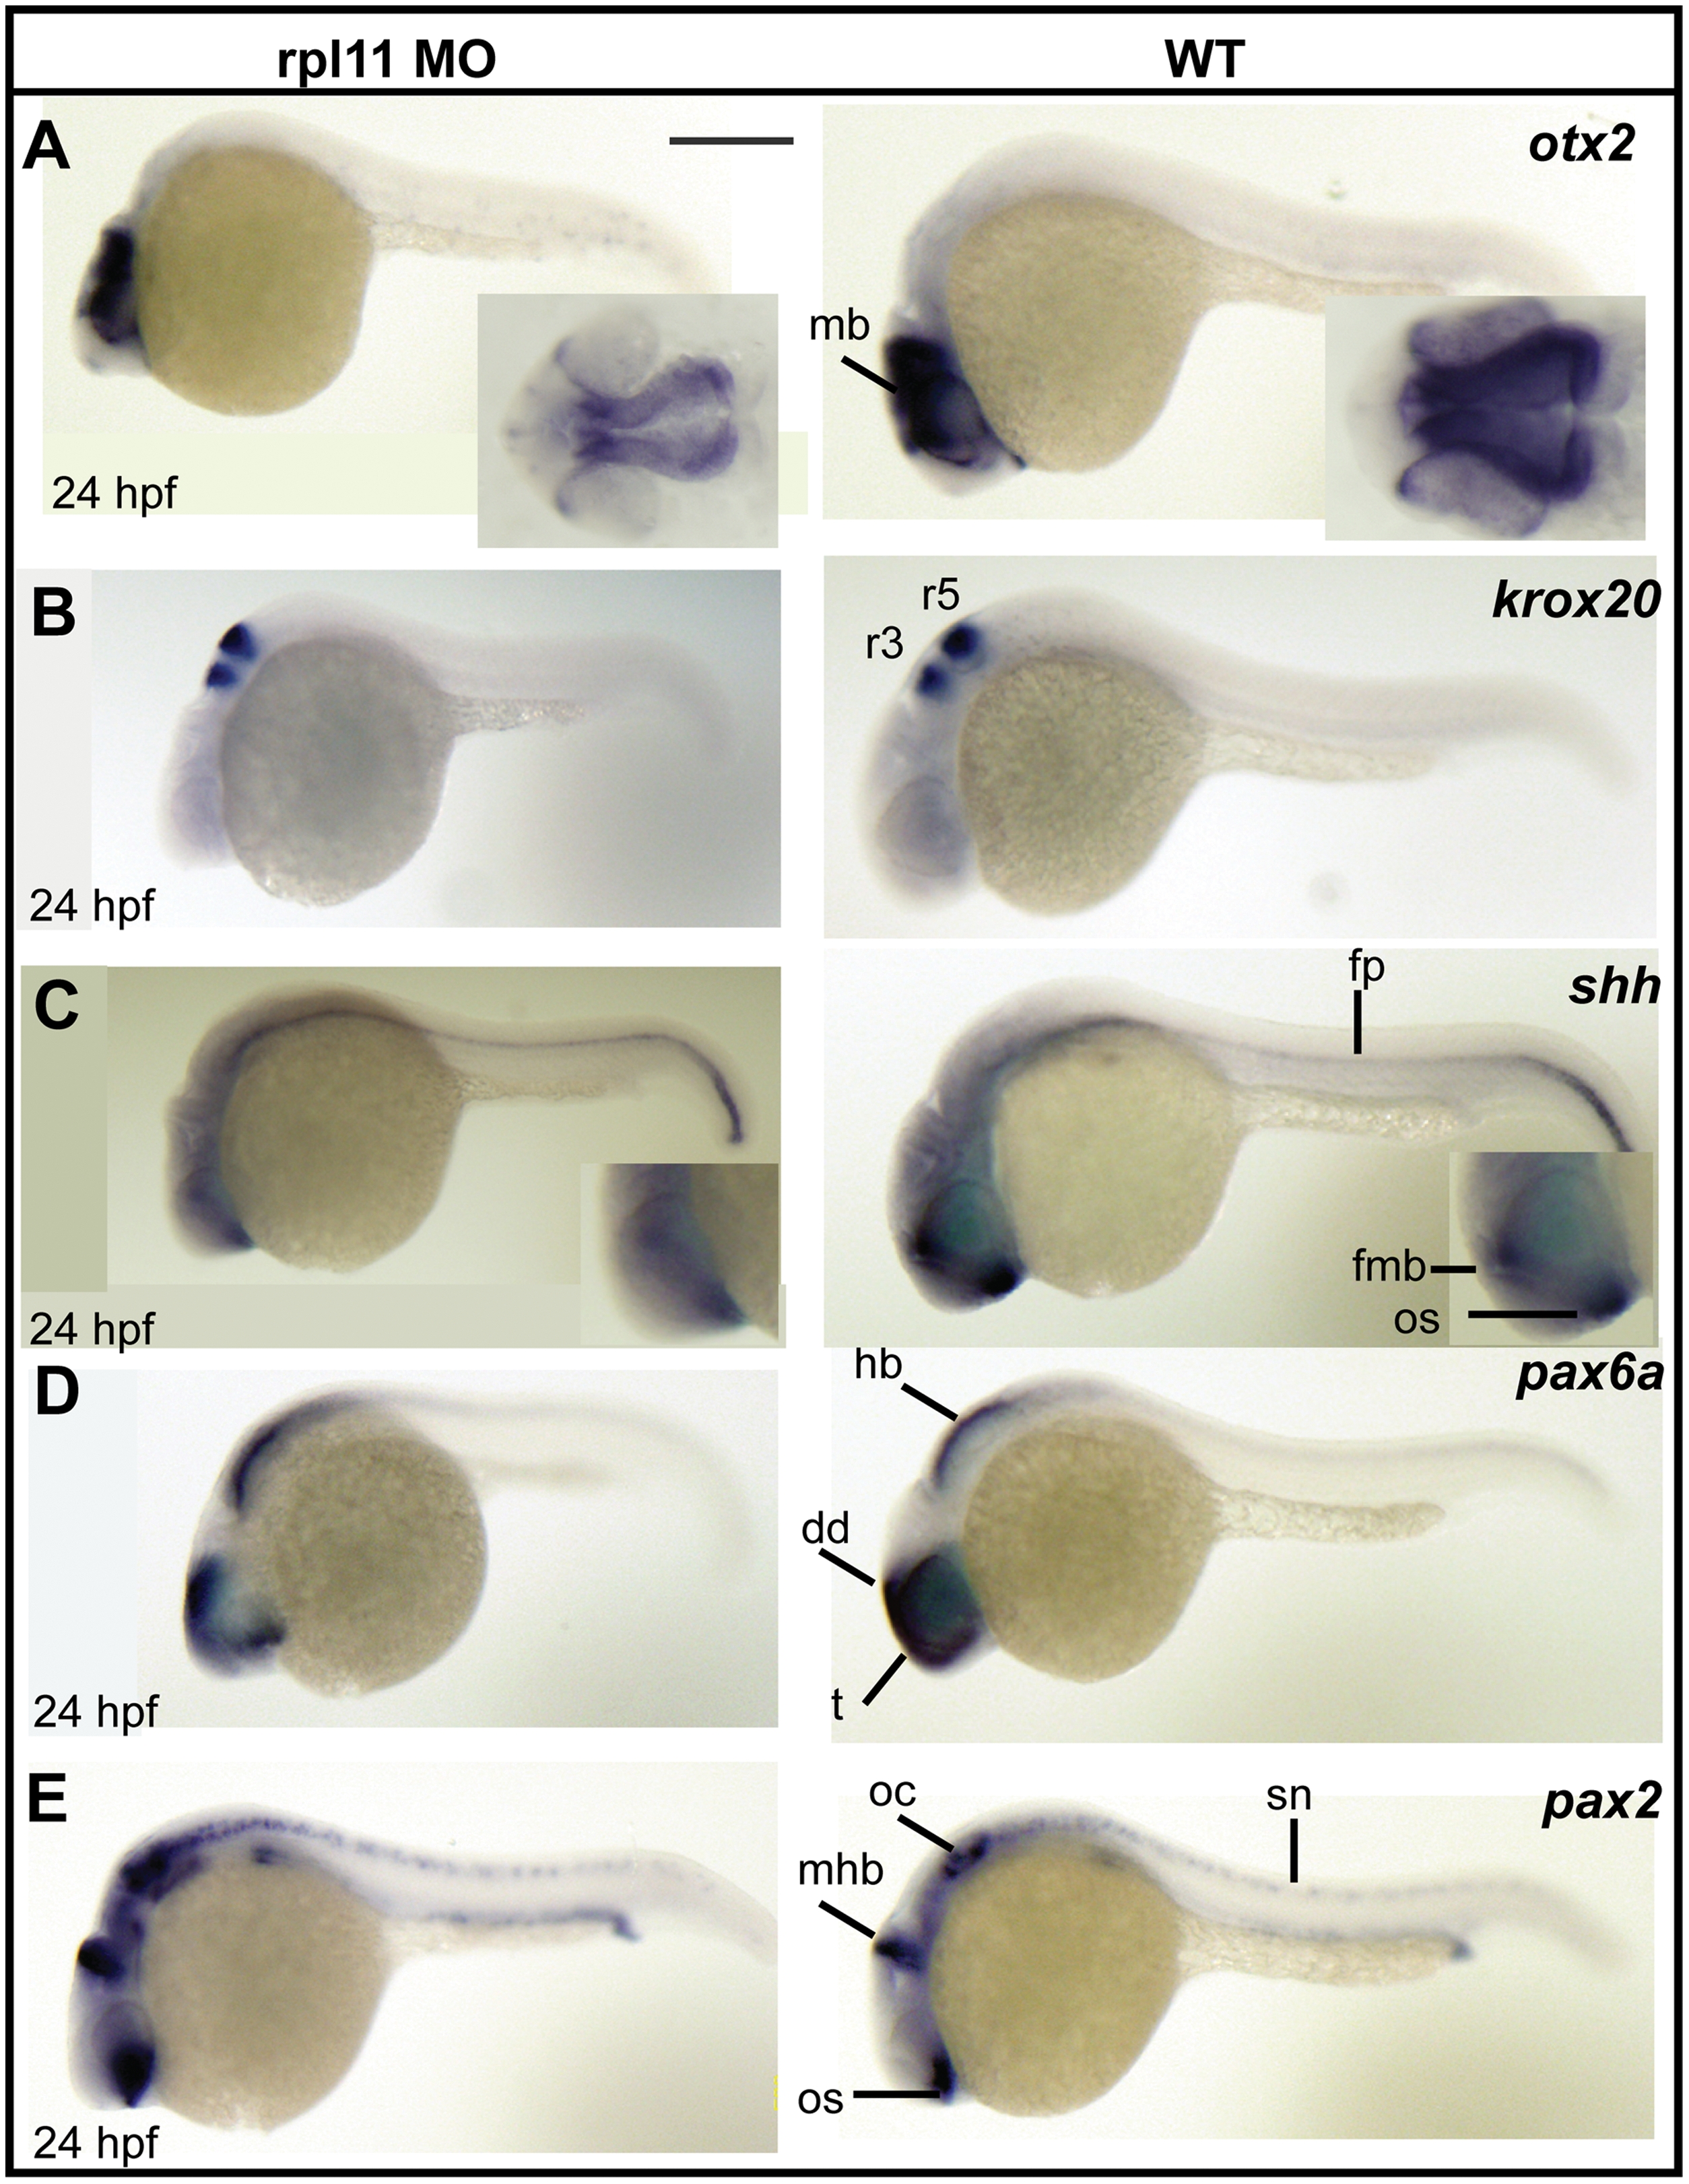
Fig. 3 The L11-deficient embryos exhibit reduced abundance of neuronal progenitor cells and aberrant expression of transcription factors.
(A) Expression of otx2 at 24 hpf. The morphants show a reduction in total abundance of otx2, but its pattern of expression is same as that of wild-type embryos. The inset shows the dorsal view of the midbrain region. (B) krox20 expression at the hindbrain in 24 hpf embryos. The morphants show a proper hindbrain patterning compared to the wild-type embryos. (C) Expression of shh in morphants and wild-type embryos at 24 hpf. The morphants show a marginal reduction in the forebrain midbrain boundary (fmb, inset in C), but floor plate (fp) expression is unaffected. (D) Expression of pax6a in morphants and wild-type embryos at 24 hpf. The morphants show a reduction in total abundance of pax6a, but its pattern of expression is same as that of wild-type embryos (E) The morphants show an increased level of pax2 expression compared to wild-type embryos. The midbrain hindbrain boundary (mhb) expression of pax2 is short and wide in the morphants. pax2 expression at the optic stalk and the otic capsules is also increased in the morphants. All images are in lateral views with anterior to the left. Scale bar: 250 μm. hb, hindbrain; dd; dorsal diencephalon; t, telencephalon; r3, rhombomere 3; r5, rhombomere 5; fmb, forebrain-midbrain boundary; os, optic stalk; mhb, midbrain-hindbrain boundary; oc, otic capsule; sn, spinal chord neurons.

