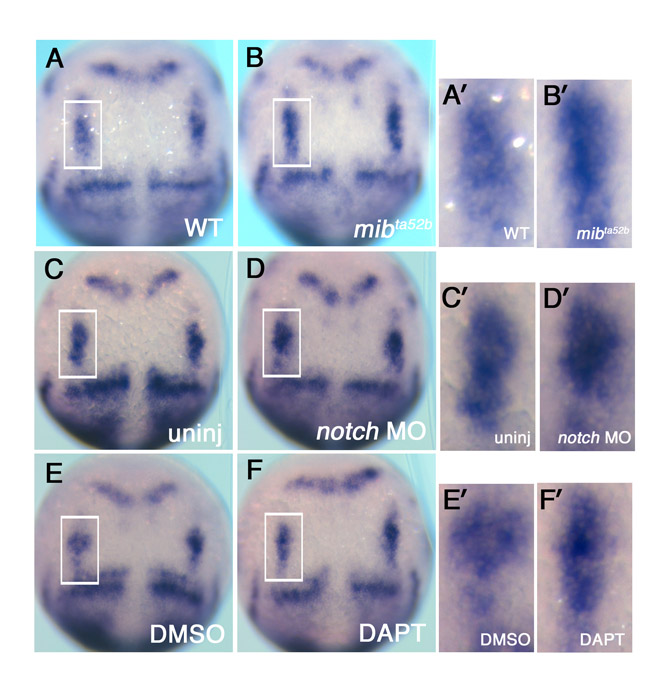
Fig. S1 Comparison of the expression of deltaD transcript following loss of Notch signalling. (A-F′) A comparison of deltaD transcripts in wild-type sibling zebrafish embryos (A,A′) with that in mib mutants (B,B′), in un-injected embryos (C,C′) with Notch MO morphants (D,D′), and in DMSO-treated controls (E,E′) with DAPT treated embryos (F,F′) at the tail bud stage. Accompanying panels on the right (A′-F′) are magnified images of neurogenic domains in hindbrain delineated with rectangles in A-F. deltaD transcripts were not significantly increased at the tail bud stage following reduced Notch signaling.
Image
Figure Caption
Acknowledgments
This image is the copyrighted work of the attributed author or publisher, and
ZFIN has permission only to display this image to its users.
Additional permissions should be obtained from the applicable author or publisher of the image.
Full text @ Development

