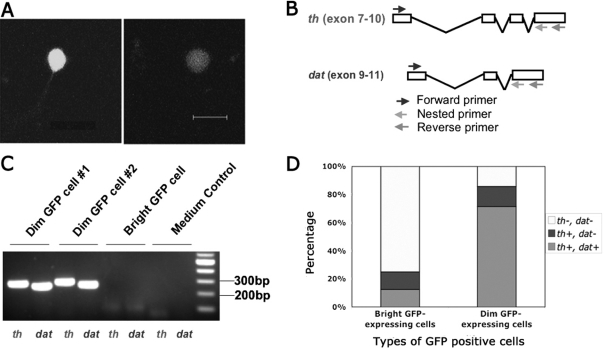
Fig. 6 Analysis of two subpopulations of GFP-positive cells using single-cell RT–PCR. A: Representative bright and dim GFP-positive cells in dispersed retinal culture were imaged at the same excitation intensity. Scale bar equals 10 μm. B: Schematic diagram shows the primers used for seminested PCR. For th, the size of the 2nd round PCR product was 277 bp. For dat, the size was 250 bp. C: Representative gel image shows the 2nd round PCR product from dim GFP cells, bright GFP cells, and medium control sample. Primer sets used were indicated at the bottom. D: Expression frequency of th and dat genes is different between bright GFP expressing cells and dim GFP expressing cells as assayed by single-cell RT–PCR. For bright GFP-expressing cells, 8 cells were examined. For dim GFP-expressing cells, 7 cells were examined.
Image
Figure Caption
Figure Data
Acknowledgments
This image is the copyrighted work of the attributed author or publisher, and
ZFIN has permission only to display this image to its users.
Additional permissions should be obtained from the applicable author or publisher of the image.

