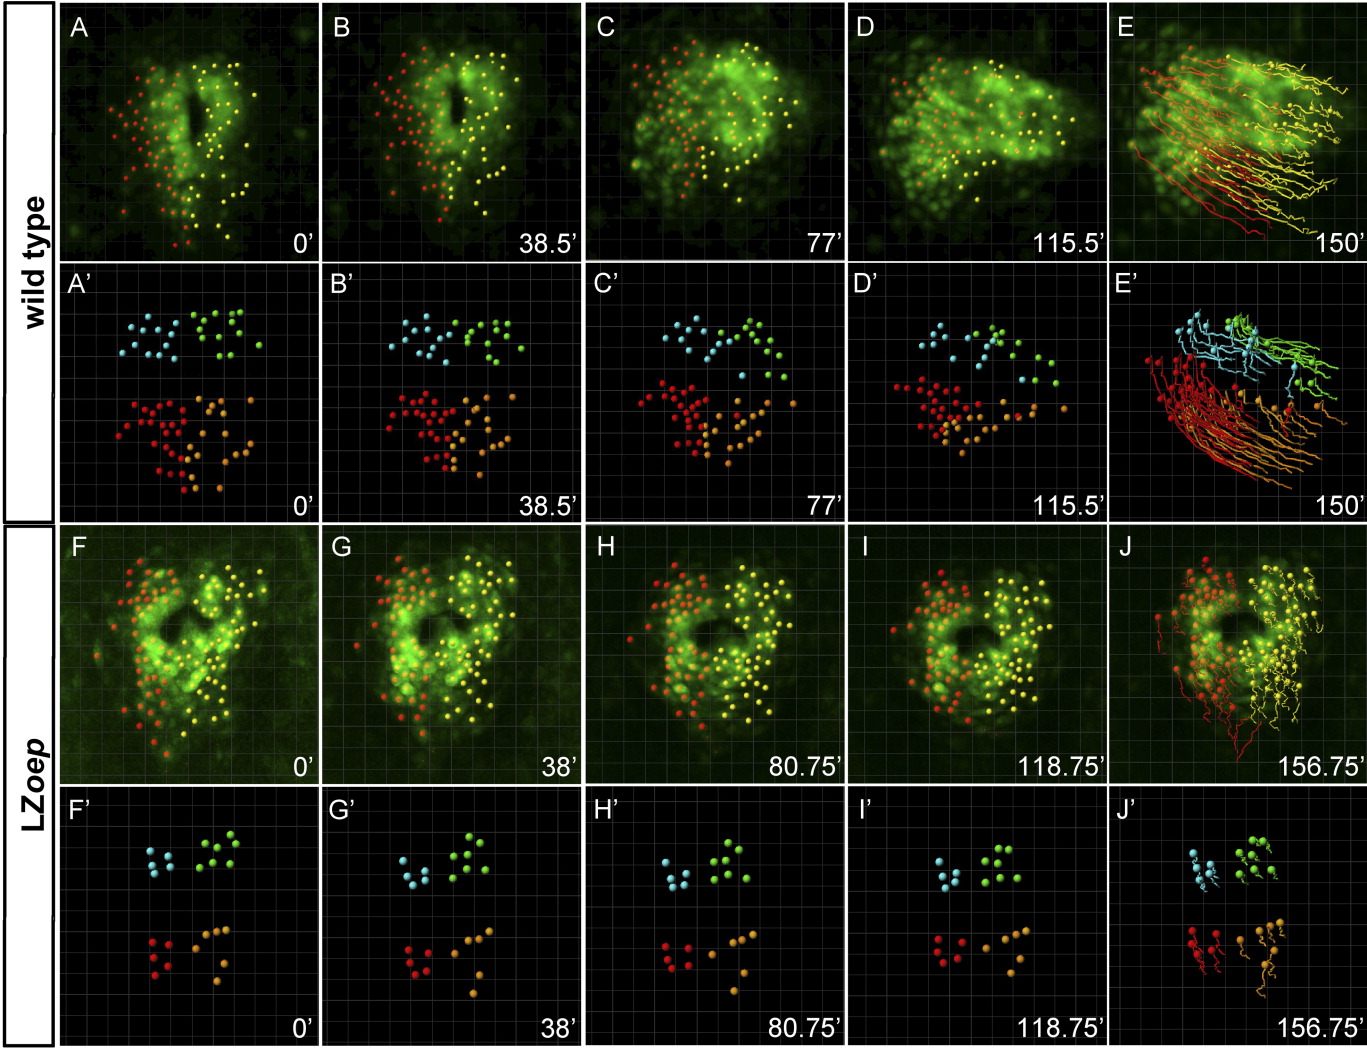
Fig. 3 Tracking of single cells in wild type and LZoep mutants. Confocal 3D-images showing individual cmlc2-GFP cells that were manually tracked starting at the onset of cardiac cone formation. First (A-E) and third (F-J) rows: green cmlc2-GFP expression; red: cells within the left side of cardiac cone; yellow: cells within the right side of cardiac cone. For detailed views from different angles, see Supplemental Movies 1 (wild type) and 5 (LZoep). Second (A′-E′) and fourth (F′-J′) rows: tracking of quadrants. Quadrants were defined by grouping left-anterior cells (blue), left-posterior cells (red), right anterior cells (green), and right-posterior cells (orange). For detailed views from different angles, see Supplemental Movies 3 (wild type) and 7 (LZoep). Pictures were cropped to keep the heart in the center and do not maintain the position of the coordinate systems. For movements with respect to coordinate systems, see Supplemental Movies 3 (wild type) and 7 (LZoep).
Image
Figure Caption
Figure Data
Acknowledgments
This image is the copyrighted work of the attributed author or publisher, and
ZFIN has permission only to display this image to its users.
Additional permissions should be obtained from the applicable author or publisher of the image.
Full text @ Dev. Dyn.

