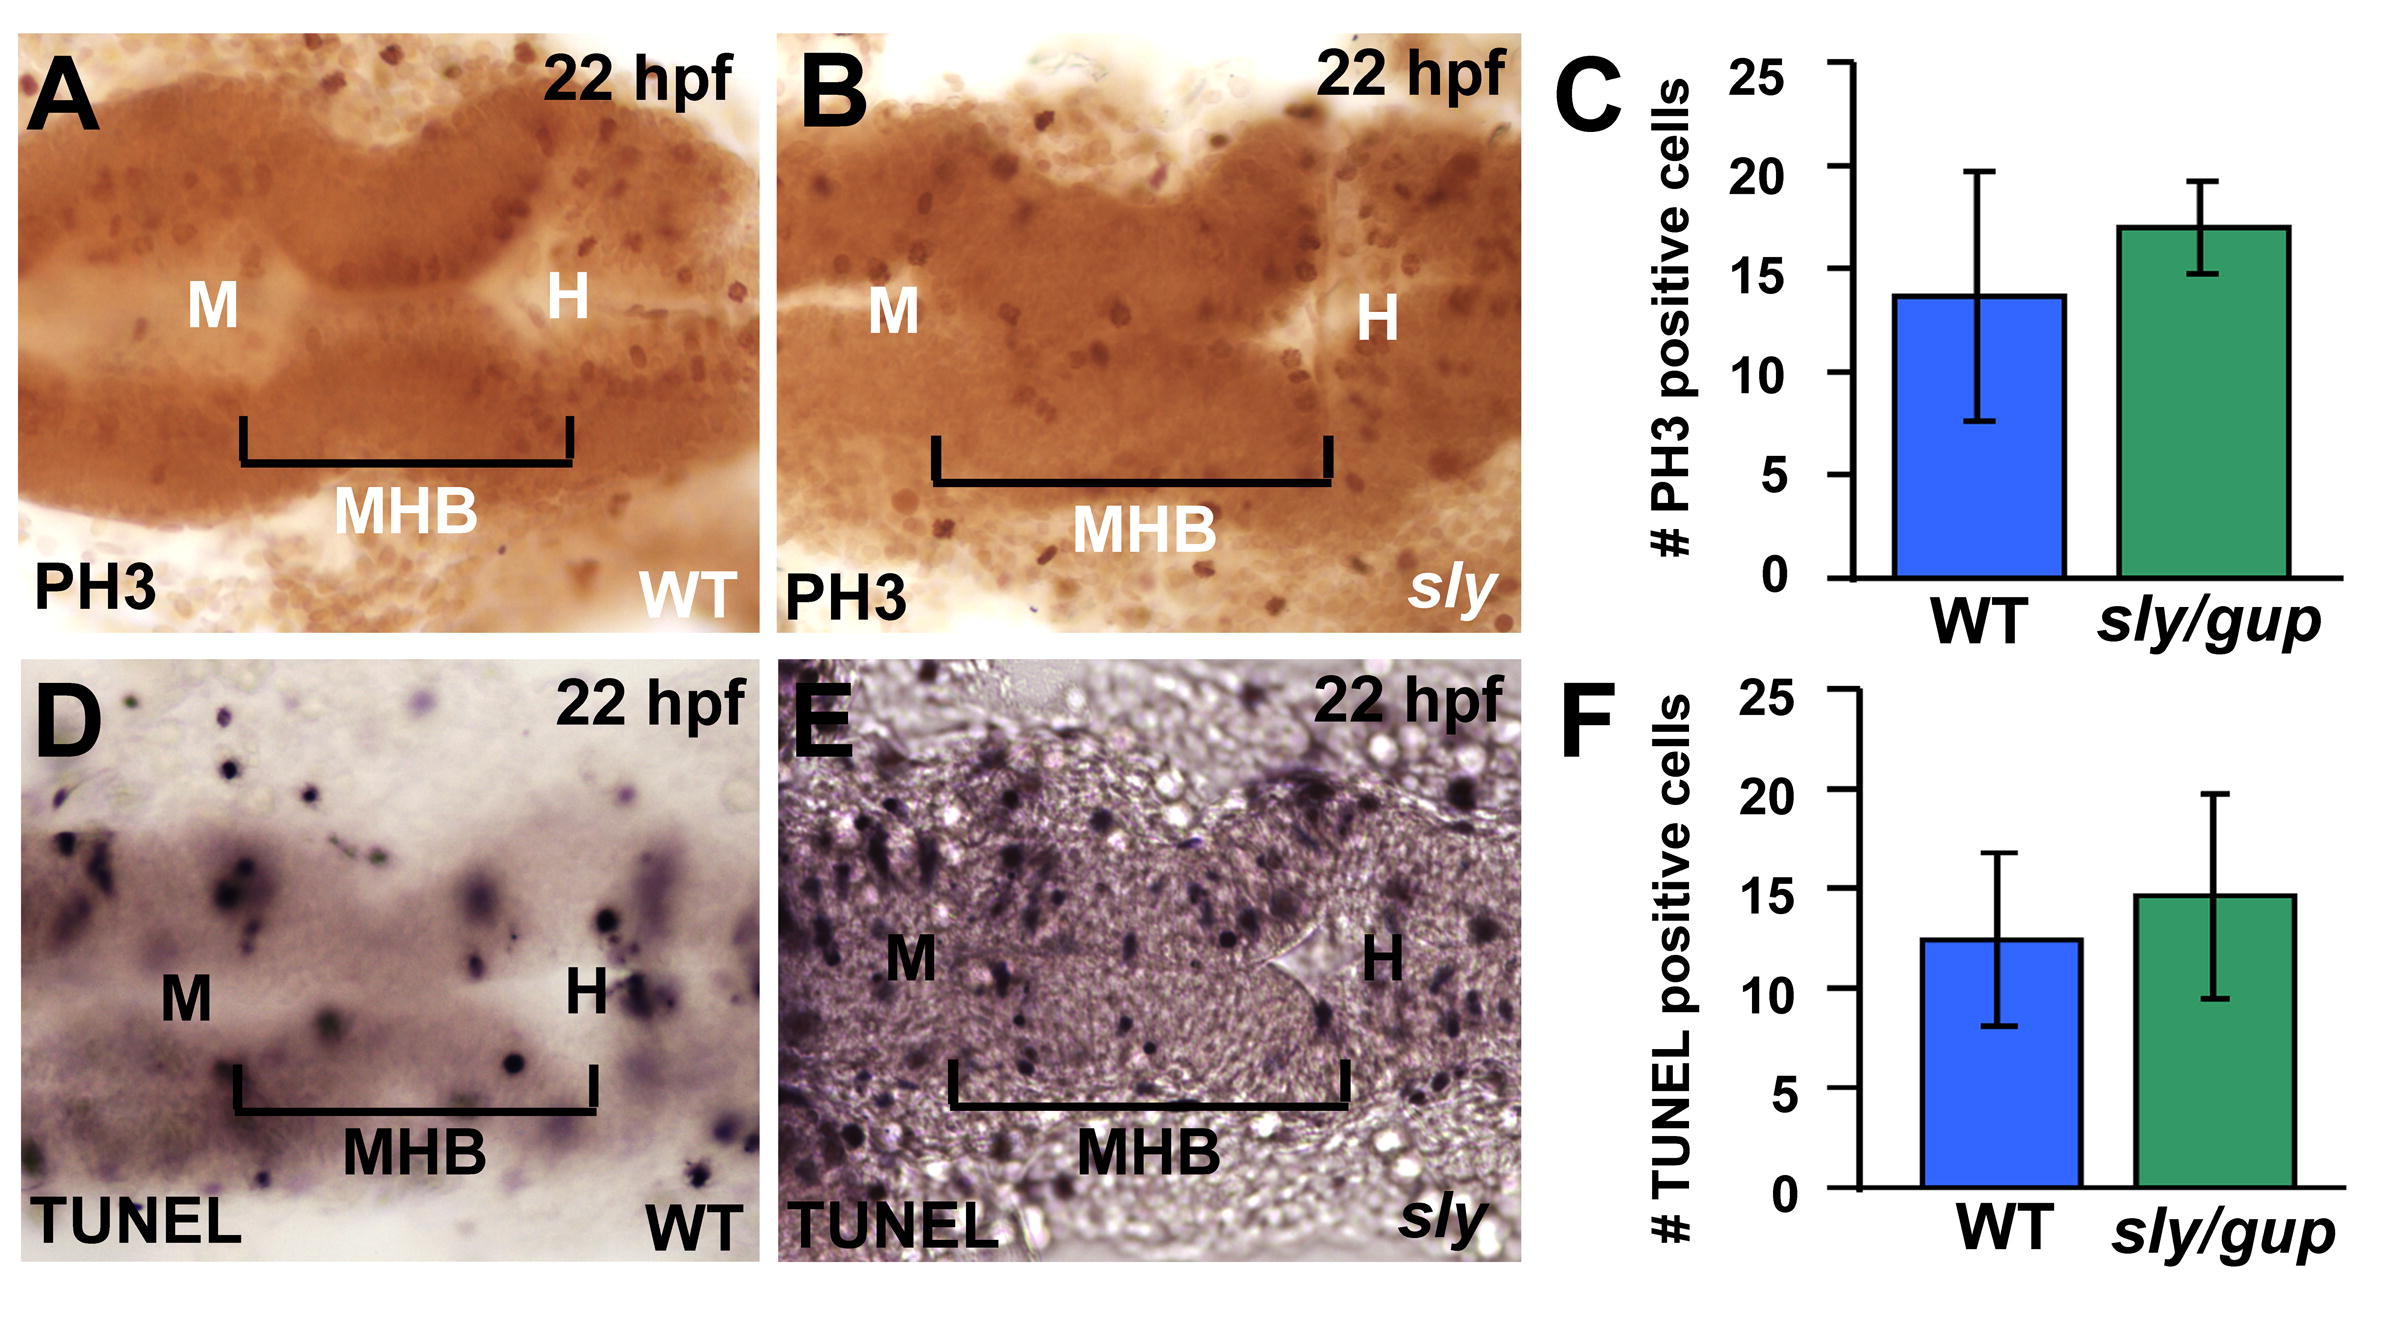
Fig. S2 Levels of proliferation and cell death in laminin mutants are normal. (A?C) Wild type and laminin mutant embryos were fixed and stained with PH3 antibody as a marker for cell proliferation at 22 hpf and the cells in the MHB were counted and compared between wild type and laminin mutants. Representative images of PH3 stained wild type and sly embryos are seen in (A and B), respectively. Quantitation of PH3 positive cells indicated that there was no difference in the number of positive cells in the MHB of laminin mutants compared to wild type controls (C). (n = 3 control, n = 5 laminin mutants; 3 sly, 2 gup) (D?E) Wild type and laminin mutants were assayed by TUNEL to determine amount of apoptosis at 22 hpf. Cells in the MHB were counted and compared between wild type and laminin mutants. Representative images of TUNEL stained wild type and sly mutants are seen in (D and E), respectively. Differences in refractility between (D and E) are due to microscope settings. Quantitation of TUNEL positive cells in the MHB of laminin mutants compared to wild type controls indicated that there was no difference in the number of positive cells (F). (n = 7 control, n = 5 laminin mutants, 3 sly, 2 gup). Anterior is to the left in all images. M, midbrain; H, hindbrain.
Reprinted from Mechanisms of Development, 125(11-12), Gutzman, J.H., Graeden, E.G., Lowery, L.A., Holley, H.S., and Sive, H., Formation of the zebrafish midbrain-hindbrain boundary constriction requires laminin-dependent basal constriction, 974-983, Copyright (2008) with permission from Elsevier. Full text @ Mech. Dev.

