Fig. 4
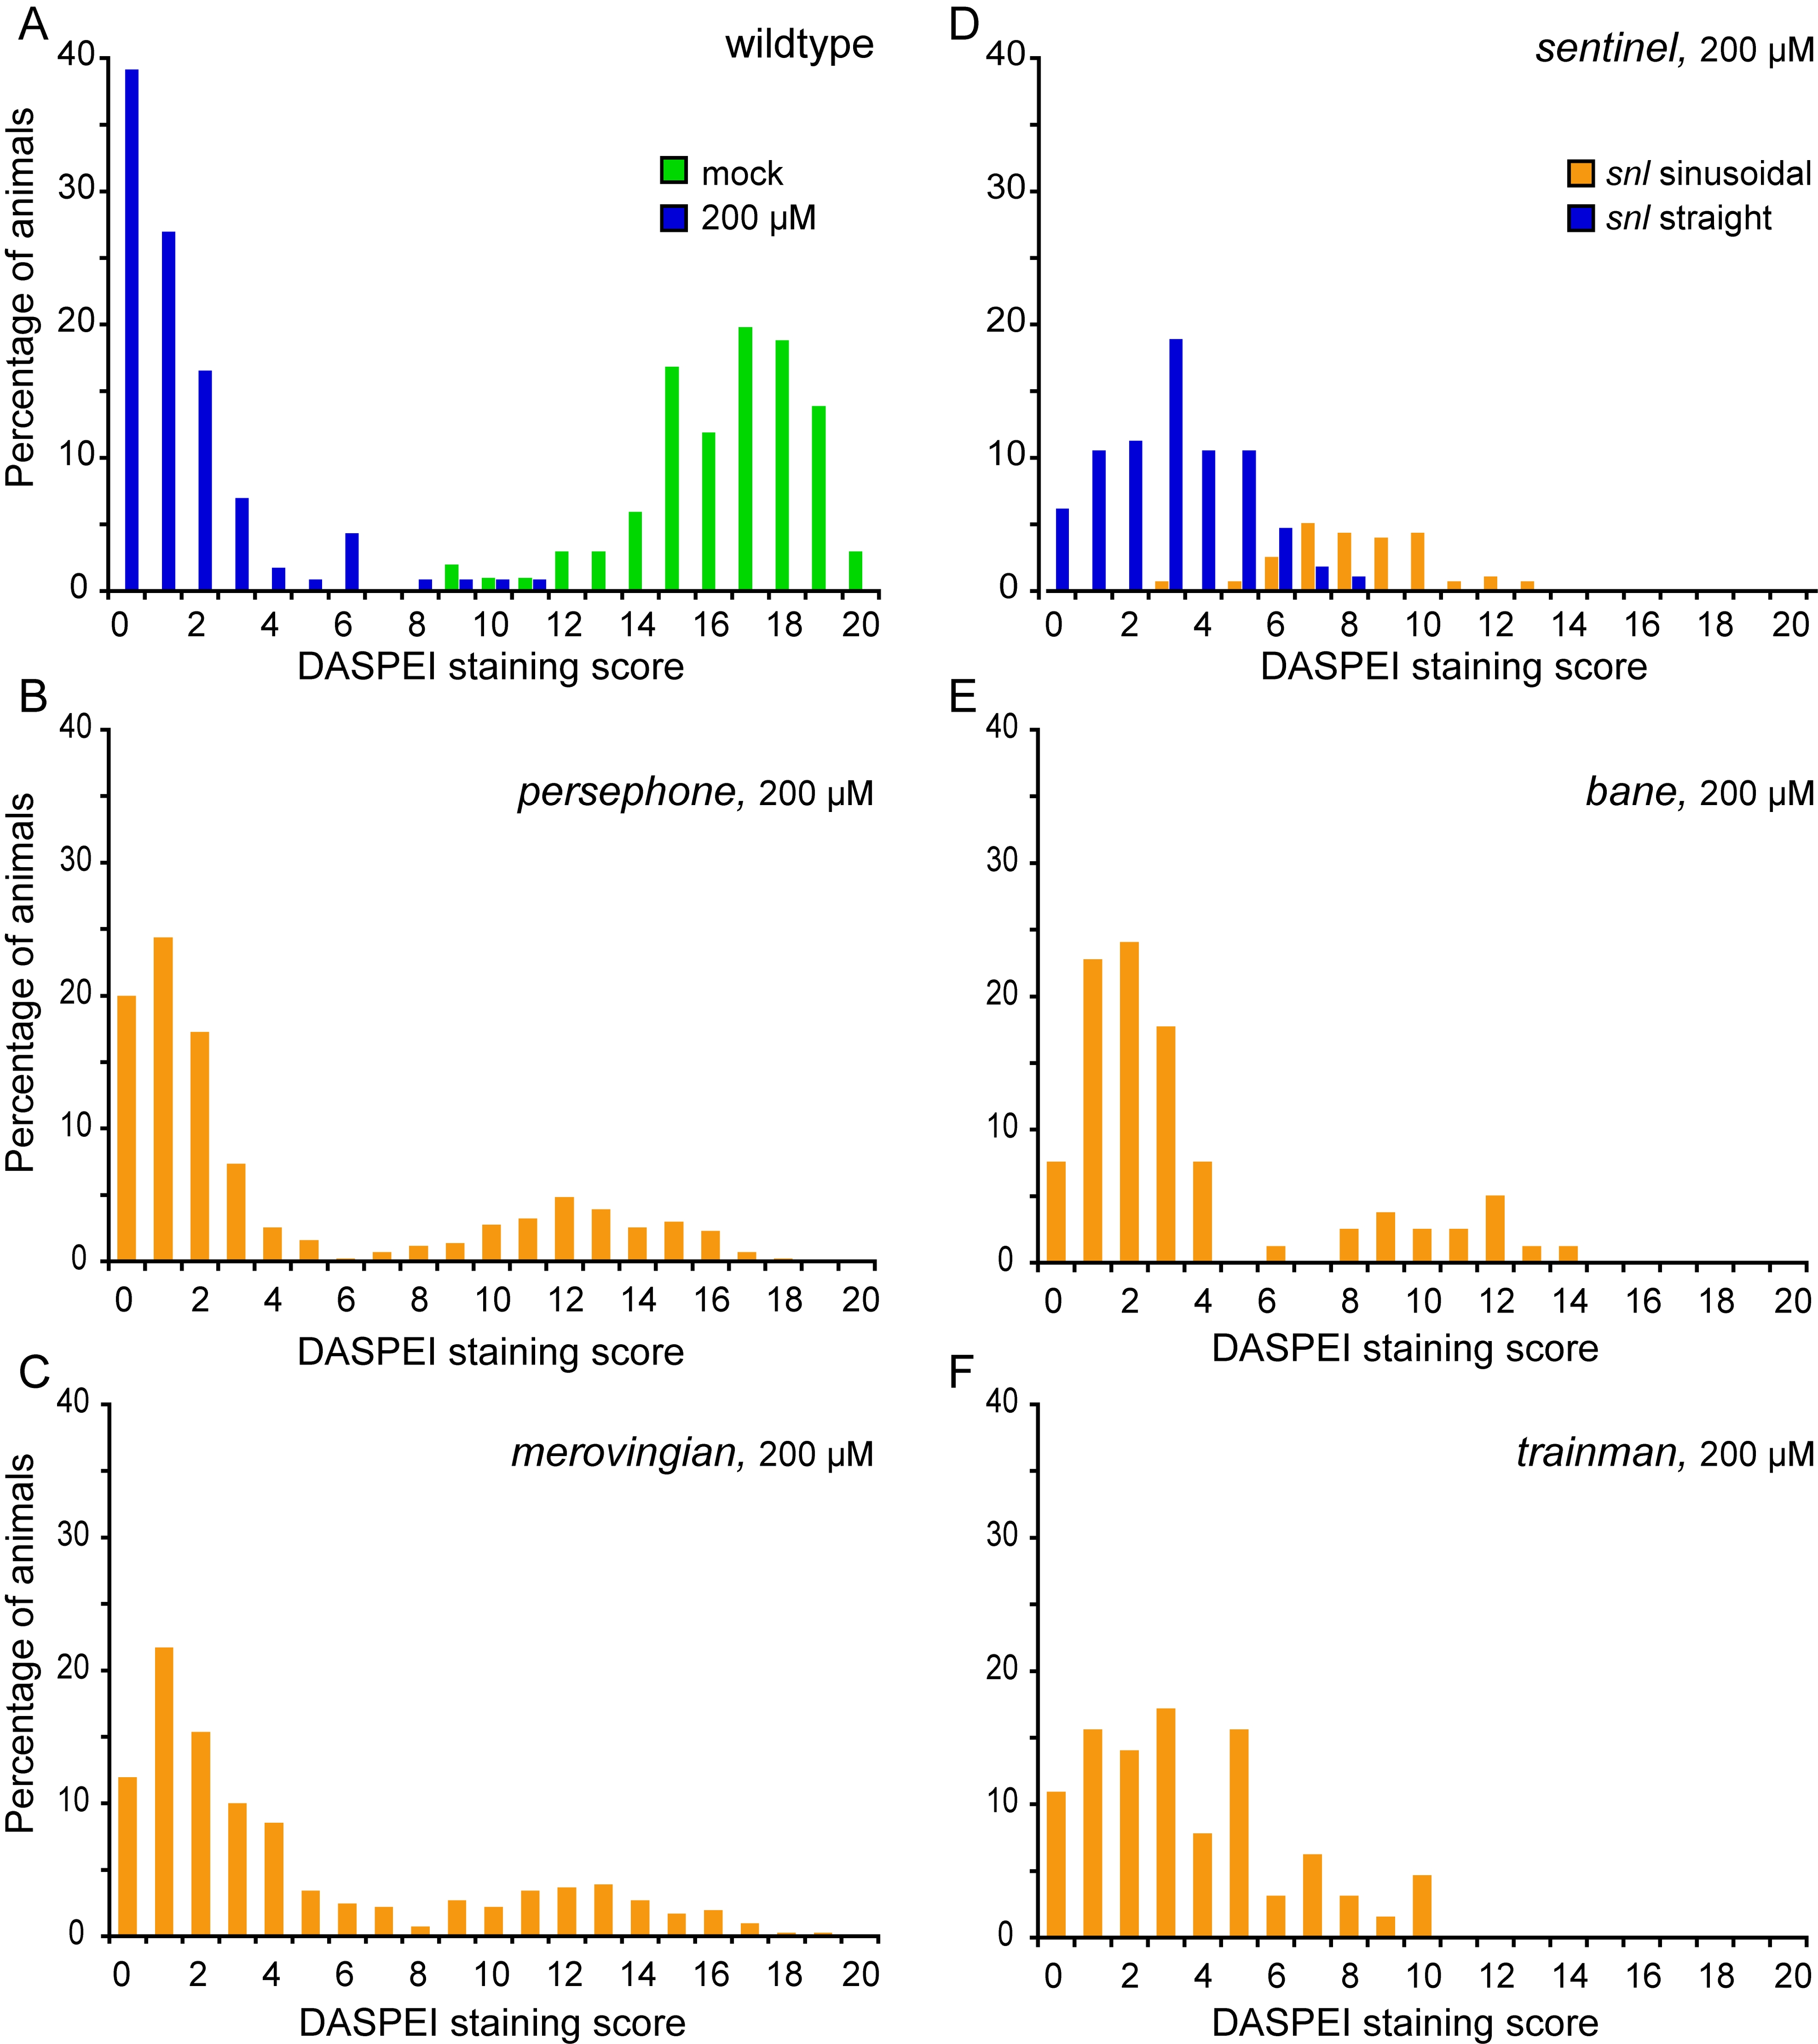
Hair cell retention after neomycin treatment in wildtype and mutant animals.
Histograms show the fraction of animals with different levels of DASPEI staining. For each animal, 10 specific neuromasts are evaluated and assigned a score of 2 (normal staining), 1 (reduced staining), or 0 (no staining) for a maximum total score of 0?20. For each group, the distribution of animals given each DASPEI staining score is displayed as a percentage of the total number of animals to illustrate the phenotypic variation within the group; 40?80 animals were tested for each group. (A) Distribution of wildtype fish after mock treatment without neomycin (green bars) or after exposure to 200 μM neomycin (blue bars). (B?F) Distribution of progeny from crosses between heterozygous mutant carriers treated with 200 μM neomycin, showing both wildtype and mutant phenotypes. (B) persephone. (C) merovingian. (D) sentinel. Animals with sinusoidal bodies (later shown to be homozygous mutants) are represented by orange bars, and animals with wildtype body shape (wildtype or heterozygous siblings) are represented by blue bars. (E) bane. (F) trainman.
Image
Figure Caption
Figure Data
Acknowledgments
This image is the copyrighted work of the attributed author or publisher, and
ZFIN has permission only to display this image to its users.
Additional permissions should be obtained from the applicable author or publisher of the image.
Full text @ PLoS Genet.

