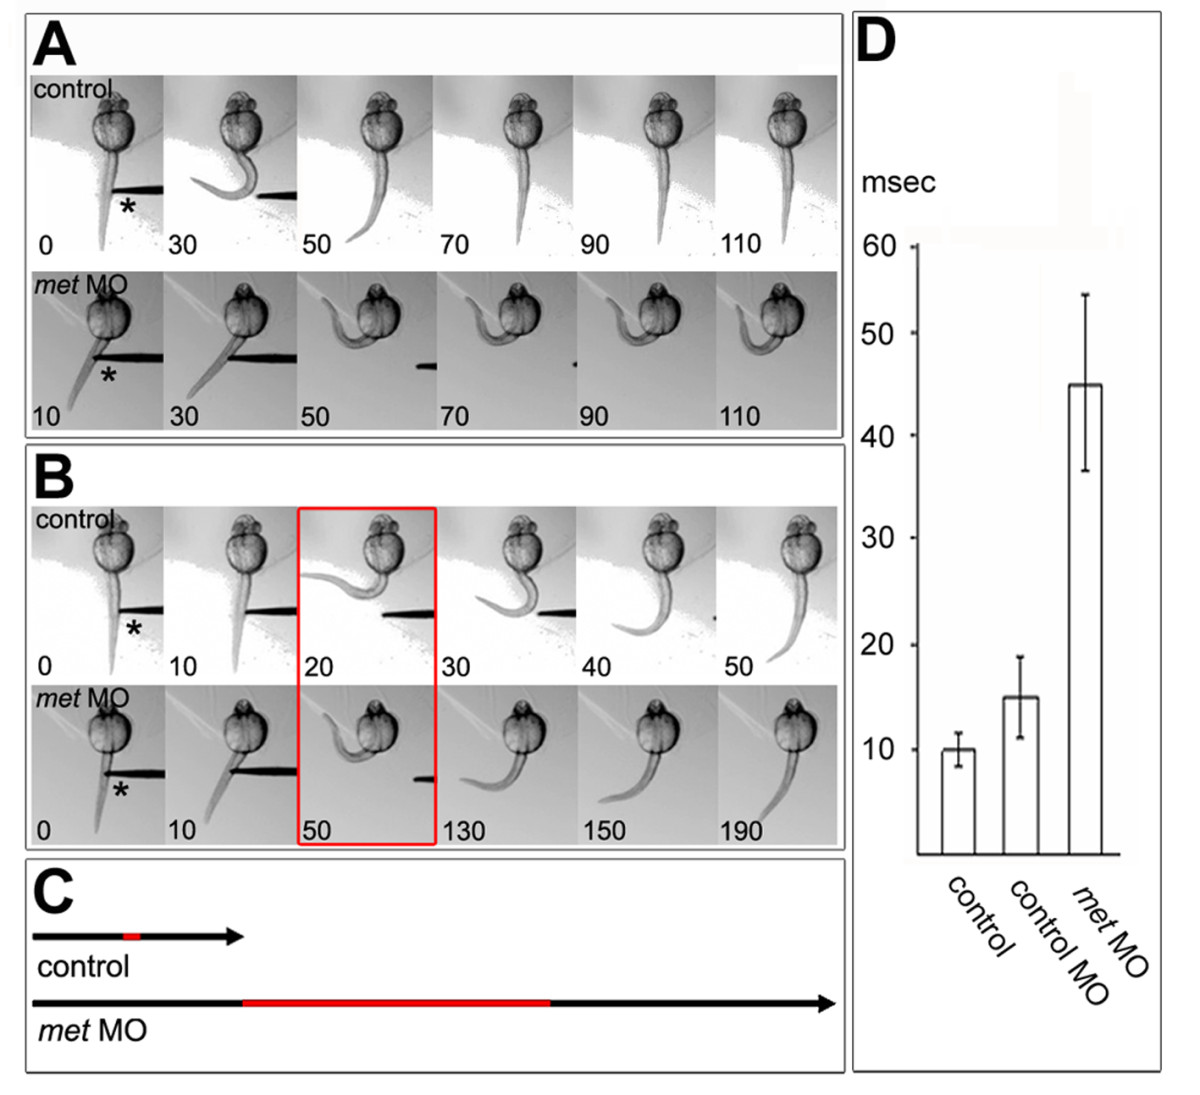
Fig. 3 Normal touch-evoked movements require Met function. Embryos are oriented anterior to the top and viewed from dorsal. (a) Control embryo (top panel), head embedded in agarose, responded to touch by bending away from the probe (asterisk); times indicated are milliseconds. A met MO-injected embryo (bottom panel) responded to touch significantly more slowly than the control. Data from the control and met MO-injected embryo are shown on the same time scale. (b) The same embryos as in (a), but for each embryo the entire time-course of the movement is shown. The entire touch response took about 50 ms in the control embryo, but took about 190 ms in the MO-injected embryo, which remained in the coiled position for about 60 ms. Red box indicates maximal bending. (c) Black arrows display the time span of one touch response, as shown in (b), for control and met MO-injected embryos; the red section indicates the time the embryo stayed in a coiled position. (d) Time frame in which control and injected embryos stayed in the coiled position [red in (b,c)]. The differences between control and control MO-injected embryos were not significantly different, but they were both significantly different from met MO-injected embryos (p < 2.6 x 10⁻¹³, n = 46 touch-evoked responses of 8 control embryos and 32 touch-evoked responses of 8 met MO-injected embryos; p < 1.07 x 10⁻⁷, n = 22 touch-evoked responses of 4 control MO-injected embryos and 32 touch-evoked responses of 8 met MO-injected embryos.
Image
Figure Caption
Figure Data
Acknowledgments
This image is the copyrighted work of the attributed author or publisher, and
ZFIN has permission only to display this image to its users.
Additional permissions should be obtained from the applicable author or publisher of the image.
Full text @ Neural Dev.

