Image
Figure Caption
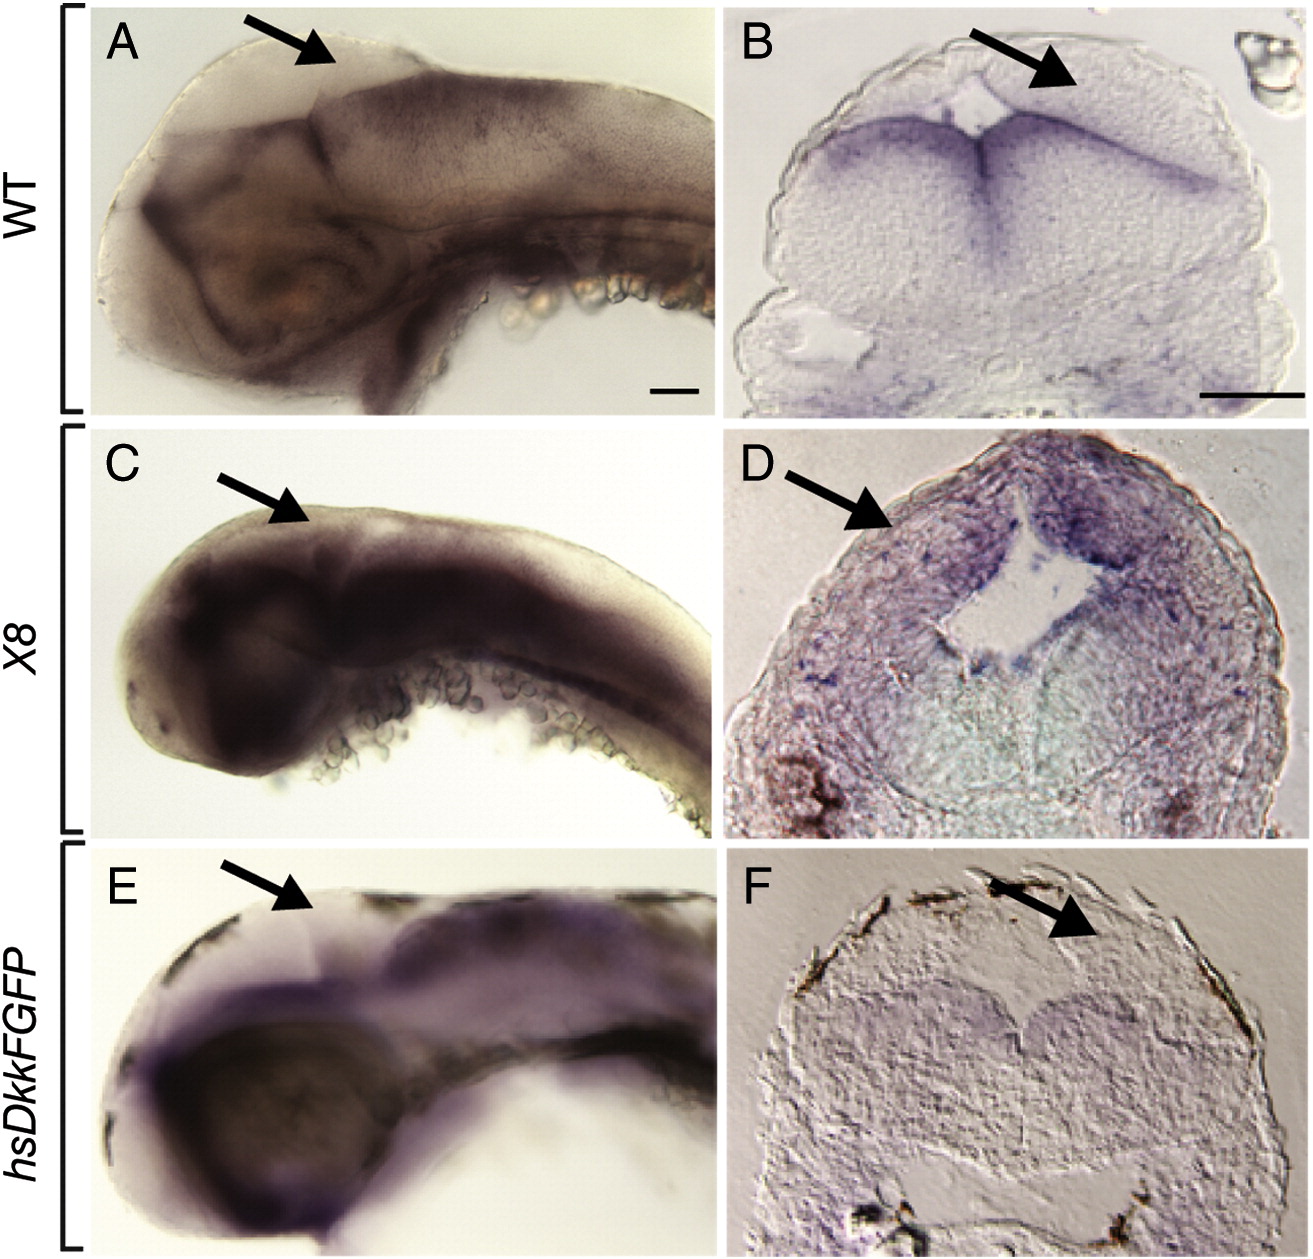
Fig. S2 Effects of Wnt signaling on ptc1 expression. All embryos shown are 48 hpf. The first column are whole mount views with anterior to the left and the second column shows transverse sections through the cerebellum. (A, B) ptc1 expression is not evident within the cerebellum of wild-type embryos. (C, D) Df(LG01:lef1)x8 mutants show an expansion of ptc1 expression into the dorsal regions of the cerebellum. (E, F) ptc1 expression is not evident in the cerebellum of transgenic embryos heat shocked to induce Dkk1 at 30 hpf. Scale bars represent 20 μm in all panels.
Figure Data
Acknowledgments
This image is the copyrighted work of the attributed author or publisher, and
ZFIN has permission only to display this image to its users.
Additional permissions should be obtained from the applicable author or publisher of the image.
Reprinted from Developmental Biology, 318(1), McFarland, K.A., Topczewska, J.M., Weidinger, G., Dorsky, R.I., and Appel, B., Hh and Wnt signaling regulate formation of olig2(+) neurons in the zebrafish cerebellum, 162-171, Copyright (2008) with permission from Elsevier. Full text @ Dev. Biol.

