Image
Figure Caption
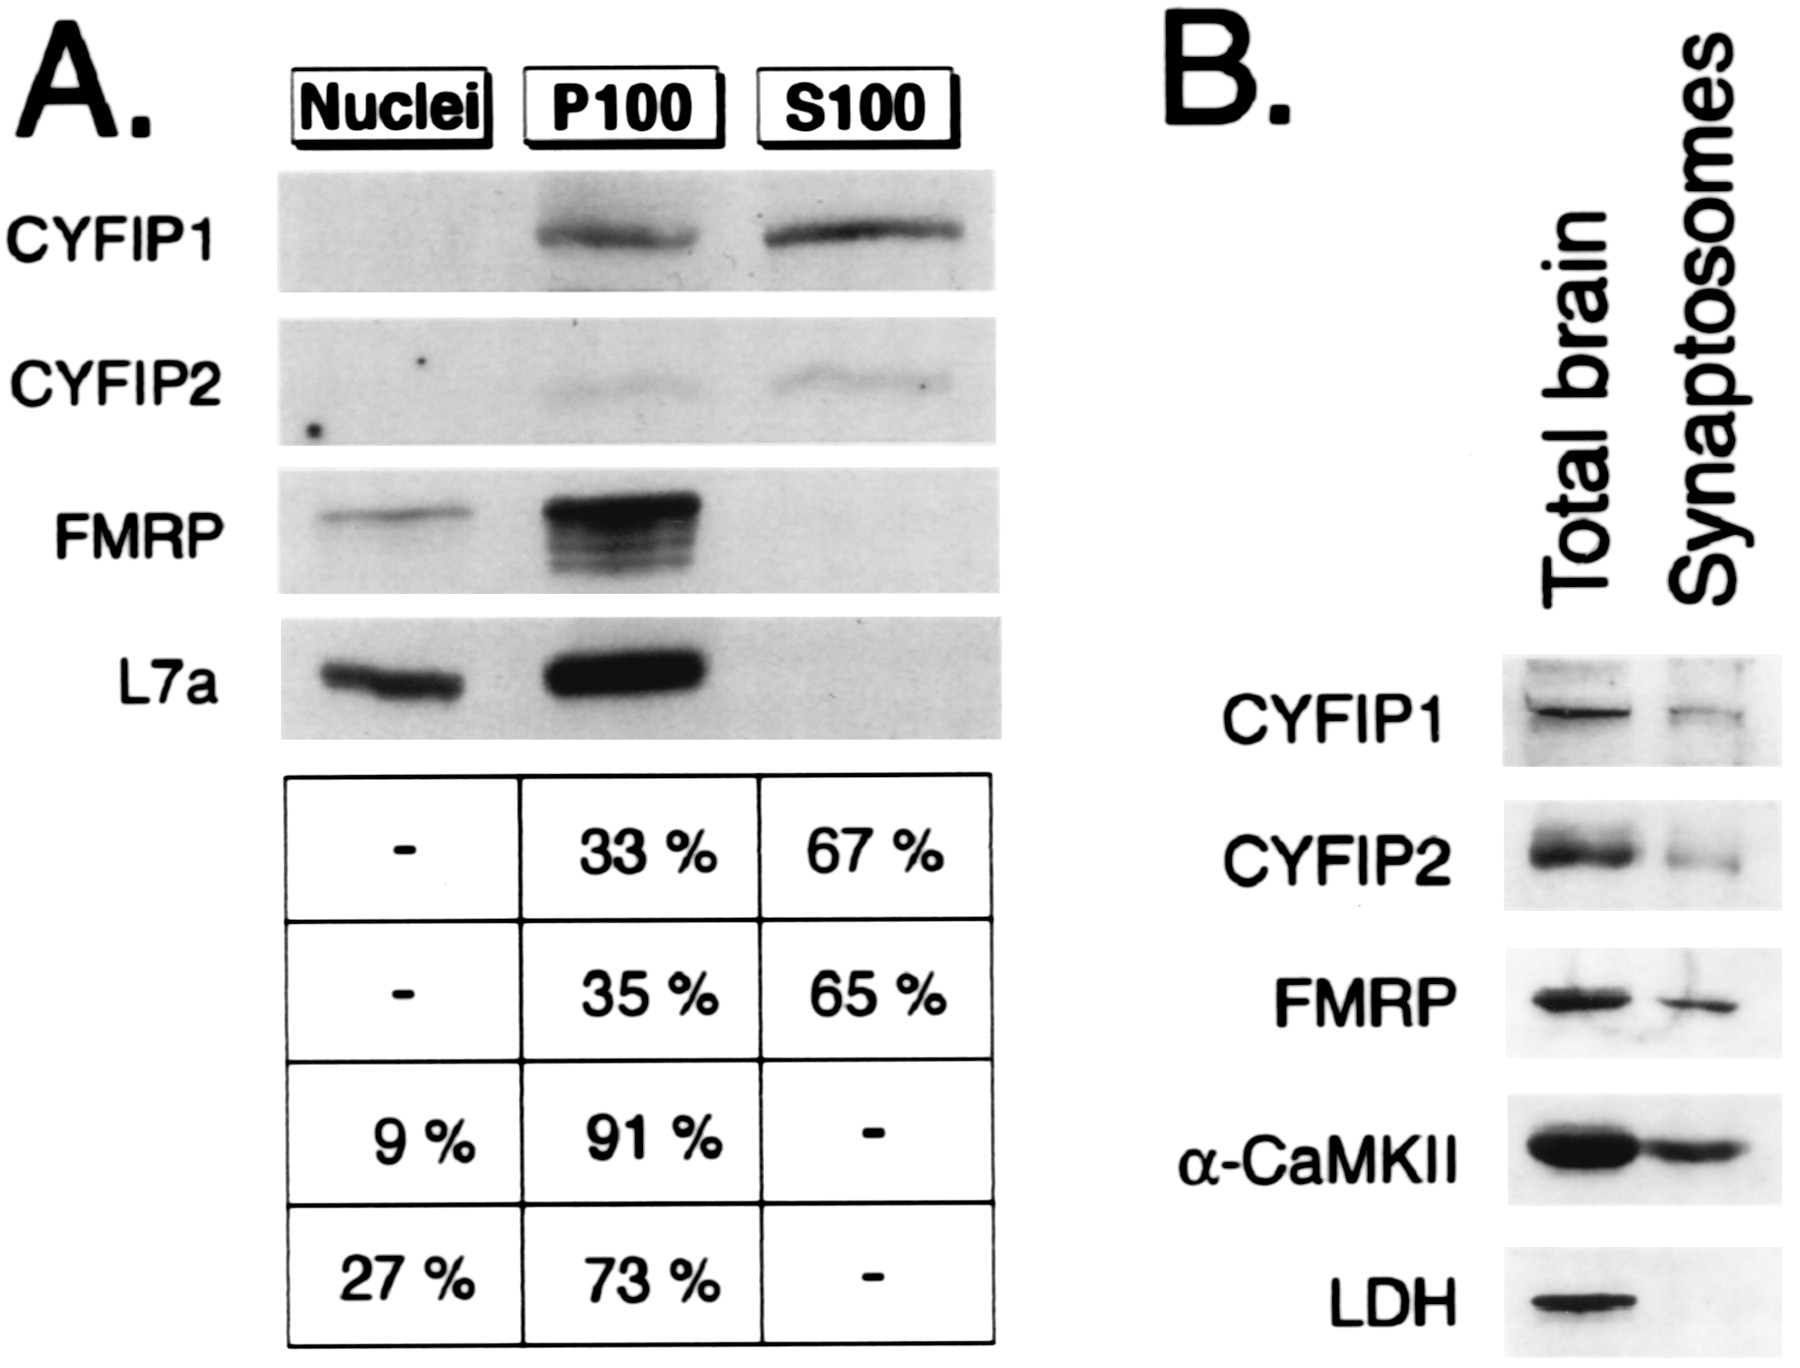
Fig. 4 Subcellular fractionations. (A) CYFIP1/2, FMRP, and L7a content in three subcellular fractions of HeLa cells analyzed by Western blot by using pAb no. 1465, pAb no. 1716, mAb 1C3, and anti-L7a. Fractions represent nuclei (N), insoluble cytoplasm (P100), and soluble cytoplasm (S100). Signals from three independent experiments were quantified. Percentage of total cellular proteins in each fraction is indicated on the right. (B) CYFIP1/2 are present in synaptosomes. Western blot analysis of proteins in total brain extract (15 μg loaded) and synaptosomal extract (14 μg loaded).
Acknowledgments
This image is the copyrighted work of the attributed author or publisher, and
ZFIN has permission only to display this image to its users.
Additional permissions should be obtained from the applicable author or publisher of the image.
Full text @ Proc. Natl. Acad. Sci. USA

