Image
Figure Caption
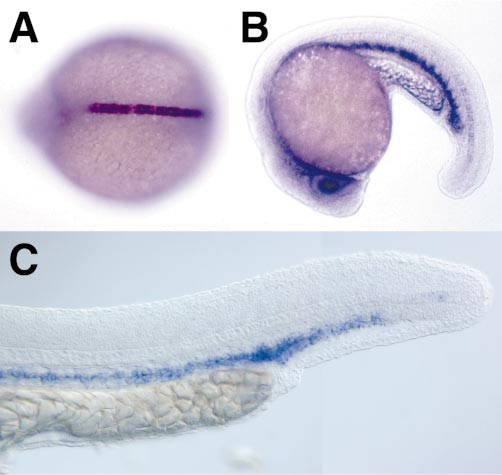
Fig. 4 Expression of tfe3a during embryogenesis. (A) 12 somite stage, dorsal view. tfe3a is first strongly expressed in the notochord. (B) 20 somite stage. Notochord expression of tfe3a diminishes rostrally and expression becomes evident in ventral mesoderm and lens. (C) 24 hpf. Expression of tfe3a through much of the ventral mesoderm.
Figure Data
Acknowledgments
This image is the copyrighted work of the attributed author or publisher, and
ZFIN has permission only to display this image to its users.
Additional permissions should be obtained from the applicable author or publisher of the image.
Reprinted from Developmental Biology, 237(2), Lister, J., Close, J., and Raible, D., Duplicate mitf genes in zebrafish: complementary expression and conservation of melanogenic potential, 333-344, Copyright (2001) with permission from Elsevier. Full text @ Dev. Biol.

