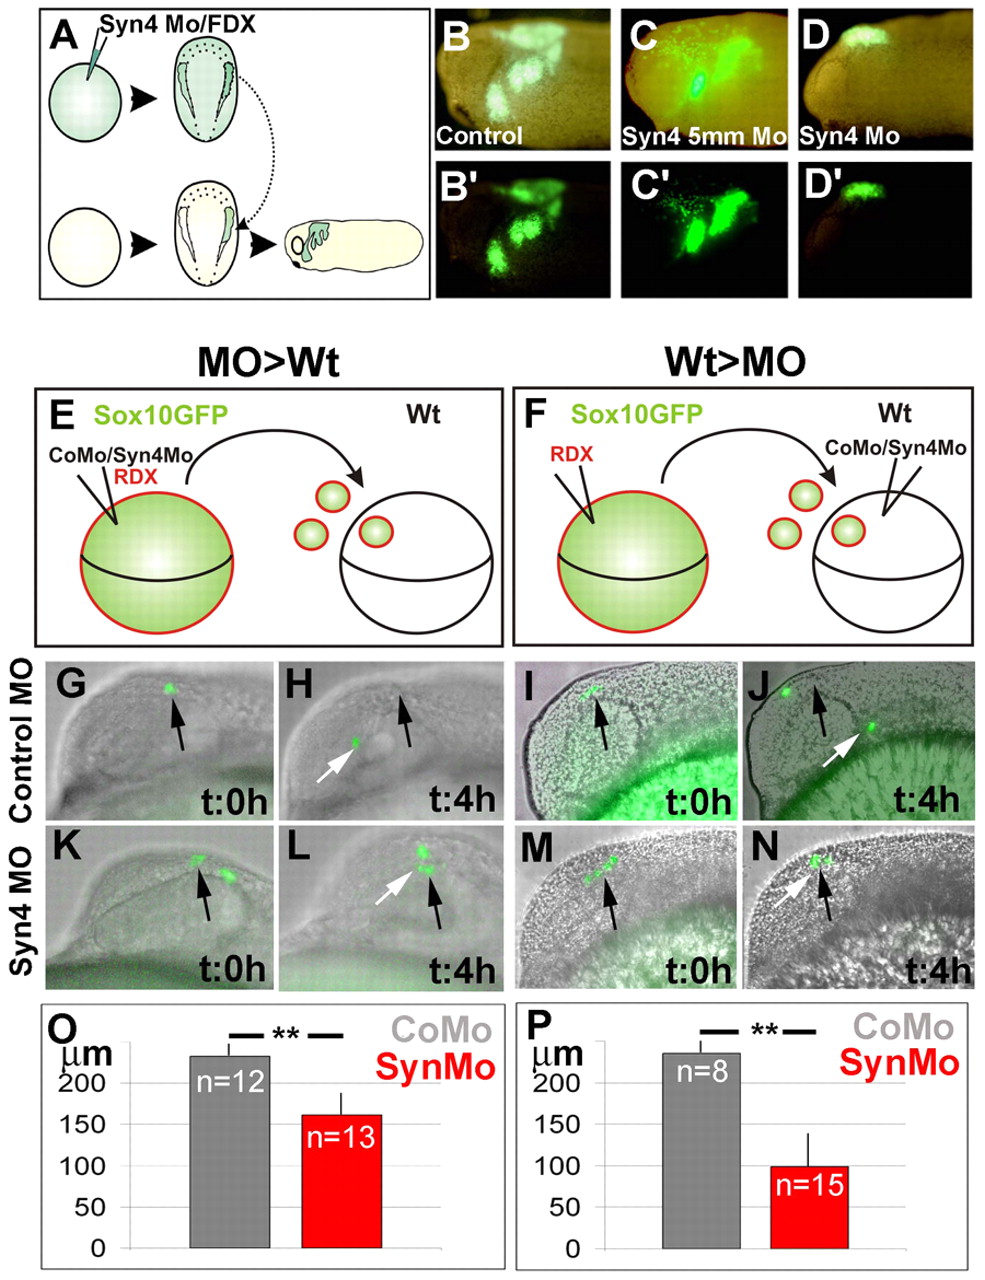
Fig. 4 Syn4 is required for NC migration in a cell- and non-cell-autonomous manner. (A-D') Xenopus NC grafts. (A) Embryos were injected at the one-cell stage with 8 ng of syn4 MO and FDX; at stage 16, the NC were dissected, grafted into a normal host and NC migration was analyzed by looking at the fluorescence. (B,B′) Control showing normal NC migration (87% of migration, n=15). (C,C′) syn4 5-base mismatch morpholino (syn4 5mm MO)-injected embryo, showing normal NC migration (75% of migration, n=12). (D,D′) syn4 MO-injected embryo showing inhibition of NC migration (0% of migration, n=15). (E-P) Zebrafish graft embryos. (E) sox10:egfp embryos were co-injected with RDX and control or syn4 MO; cells taken from these embryos were grafted into wild-type embryos and NC migration was analyzed. (F) sox10:egfp embryos were injected with RDX; cells taken from these embryos were grafted into wild-type embryos previously injected with control or syn4 MO and NC migration was analyzed. (G-N) GFP-expressing cells were overlapped on DIC image. Black arrow indicates the initial position of the NC; white arrow indicates the position of the NC after 4 hours. (G-J) Control MO; (K-N). syn4 MO. (O) Average distance traveled for the grafted cells in 4 hours in experiment shown in E. (P) Average distance traveled for the grafted cells in 4 hours in experiment shown in F. **P<0.005.
Image
Figure Caption
Acknowledgments
This image is the copyrighted work of the attributed author or publisher, and
ZFIN has permission only to display this image to its users.
Additional permissions should be obtained from the applicable author or publisher of the image.
Full text @ Development

