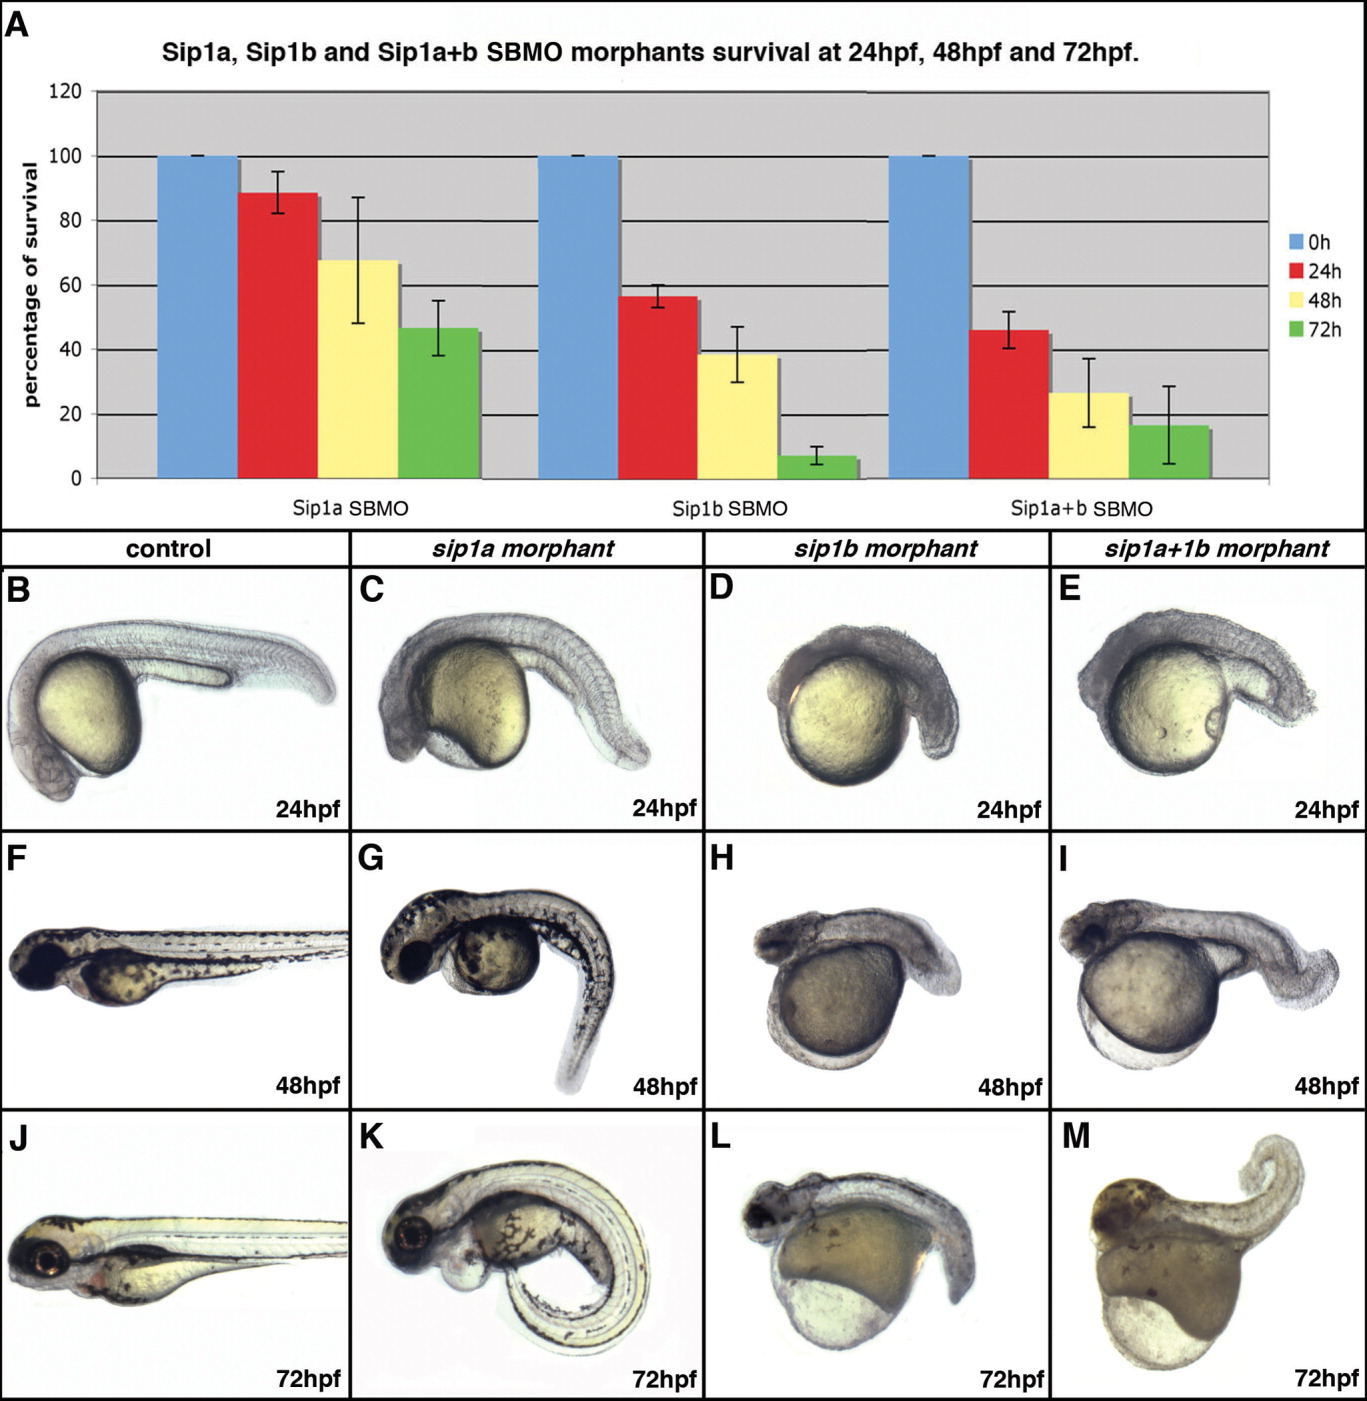
Fig. 2 Effect of sip1a and sip1b splice blocking antisense morpholino oligonucleotide injection on survival and morphological development at 24-72hpf. A: Bar graph showing the percent of surviving sip1a SBMO morphants, sip1b SBMO morphants, and sip1a sip1b double morphants at 24, 48, and 72 hpf. The numbers represent the percent of injected embryos surviving at each specific time point ± s.e.m. based on 3 independent experiments. B-M: Lateral views of control (B, F, J), sip1a morphant (C, G, K), sip1b morphant (D, H, L), and sip1a sip1b double morphant (E, I, M) embryos at 24hpf (B-E), 48hpf (F-I), and 72 (J-M) hpf. Anterior is to the left.
Image
Figure Caption
Figure Data
Acknowledgments
This image is the copyrighted work of the attributed author or publisher, and
ZFIN has permission only to display this image to its users.
Additional permissions should be obtained from the applicable author or publisher of the image.
Full text @ Dev. Dyn.

