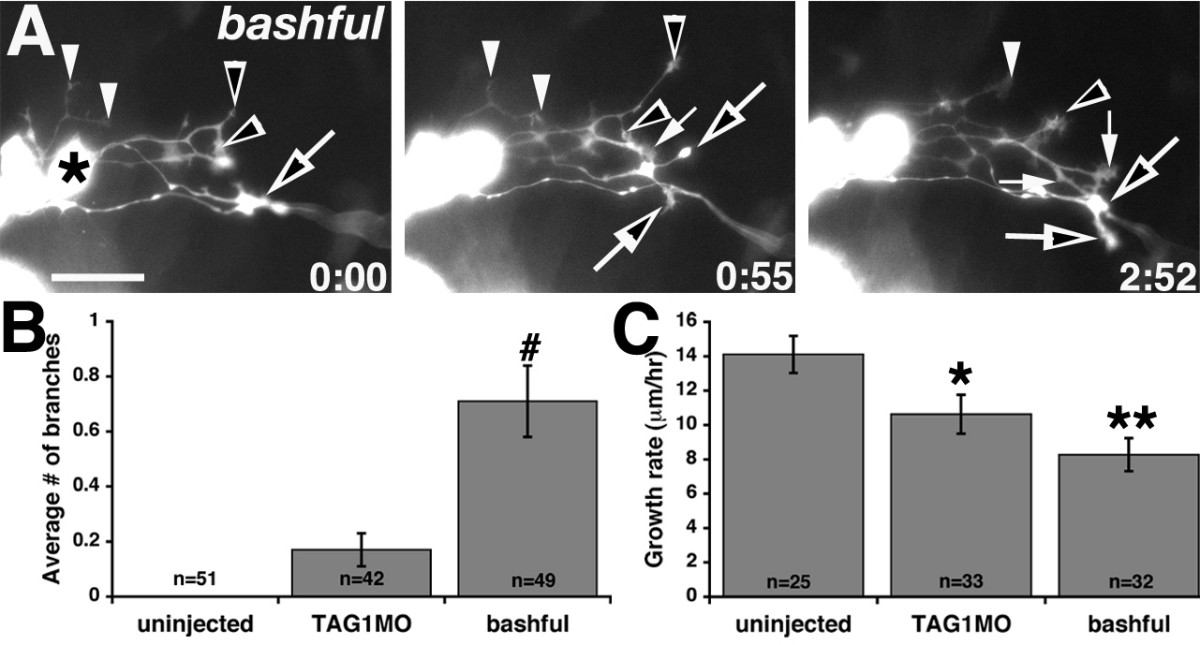
Fig. 6 bal embryos have excessively branched axons and MLF growth rates are reduced by TAG-1 or laminin-α1 loss of function.(a) Images from timelapse sequence of MLF axon outgrowth in a bal;Tg(pitx2c:gfp) embryo. Ventral views, anterior to the left, midline is up. The asterisk denotes the caudal-most nucMLF cell. Open and filled arrows and arrowheads label branches from individual axons. The time stamp shows hours: minutes. (b, c) Quantification of the average number of branches per axon (b) and the average growth rate of MLF axons (c). #P < 0.001, Kruskal-Wallis ANOVA versus uninjected. *P < 0.05, **P < 0.001, two-tailed t-test versus uninjected. Error bars represent the standard error of the mean. N equals the number of axons. Scale bar = 25 μm.
Image
Figure Caption
Figure Data
Acknowledgments
This image is the copyrighted work of the attributed author or publisher, and
ZFIN has permission only to display this image to its users.
Additional permissions should be obtained from the applicable author or publisher of the image.
Full text @ Neural Dev.

