
Image
|
Figure Caption
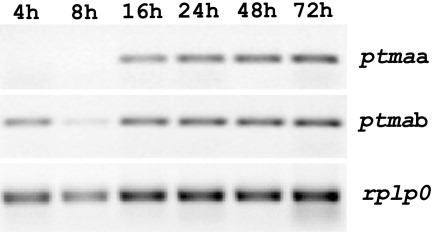
Fig. 2 Temporal expression pattern of zebrafish ptmaa and ptmab determined by RT-PCR analysis at different embryonic stages indicated on top as hours post fertilization (h). Amplification of rplp0 cDNA fragment was a control of RT-PCR sensitivity in the assay.
Figure Data
Acknowledgments
This image is the copyrighted work of the attributed author or publisher, and
ZFIN has permission only to display this image to its users.
Additional permissions should be obtained from the applicable author or publisher of the image.
Full text @ Dev. Dyn.