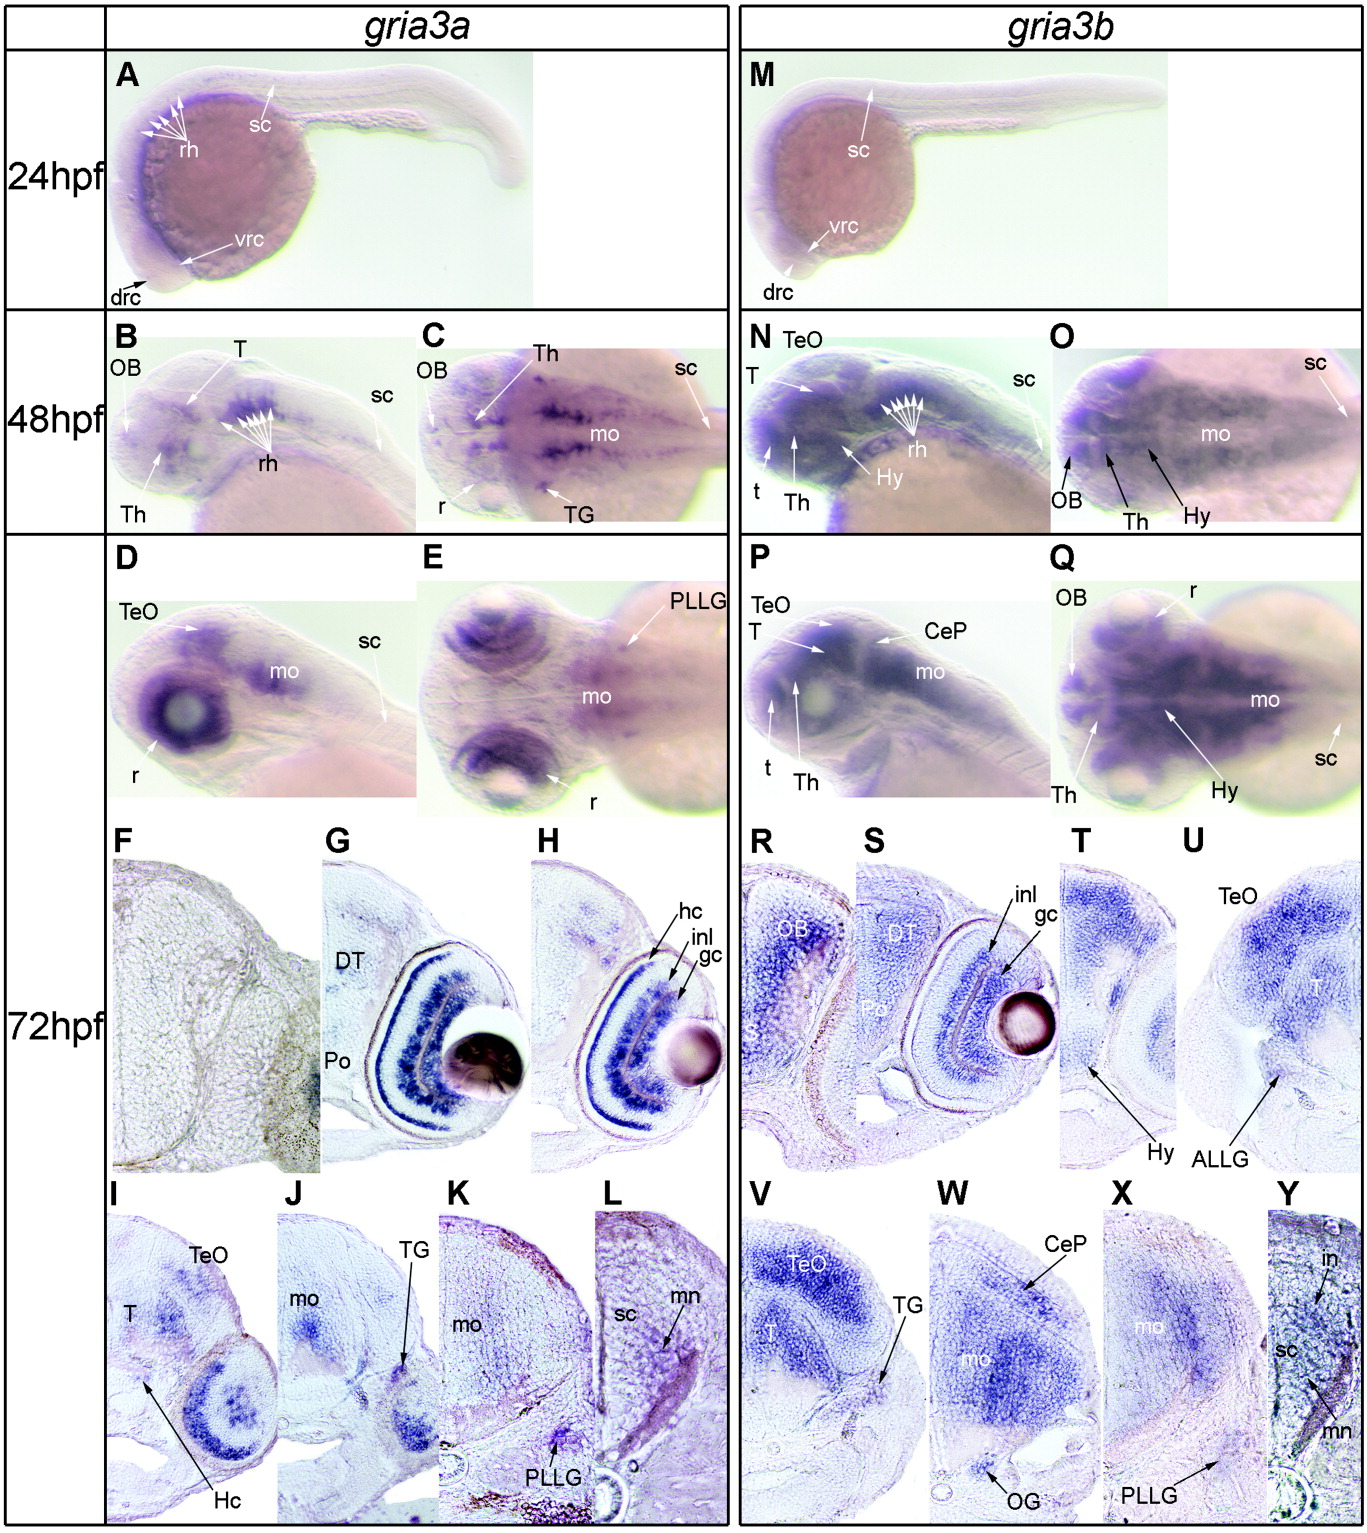
Fig. 3 Expression of the paralogous AMPA receptor subunit genes gria3a and gria3b in zebrafish at 24, 48, and 72 hours postfertilization (hpf). A: gria3a expression at 24 hpf, lateral view. B,C: The expression pattern of gria3a at 48 hpf (B: lateral view; C: dorsal view). D,E: Expression of gria3a in the CNS in a 72 hpf zebrafish larvae (D: lateral view; E: dorsal view). F-L: The 20-μm-thick frontal Vibratome sections through a gria3a hybridized zebrafish larvae at 72 hpf. M: Gene expression of gria3b at 24 hpf, lateral view. N,O: Expression of gria3b in the central nervous system in a 48 hpf zebrafish embryo (N: lateral view; O: dorsal view). P,Q: gria3b expression in a 72 hpf zebrafish embryo (P: lateral view; Q: dorsal view). R-W: Frontal, 20-μm-thick Vibratome sections through a gria3b hybridized zebrafish larvae at 72 hpf. ALLG, anterior lateral line ganglion; hc, horizontal cells; OG, octaval ganglion; TG, trigeminal ganglion. Other abbreviations as in Figures 1 and 2.
Image
Figure Caption
Figure Data
Acknowledgments
This image is the copyrighted work of the attributed author or publisher, and
ZFIN has permission only to display this image to its users.
Additional permissions should be obtained from the applicable author or publisher of the image.
Full text @ Dev. Dyn.

