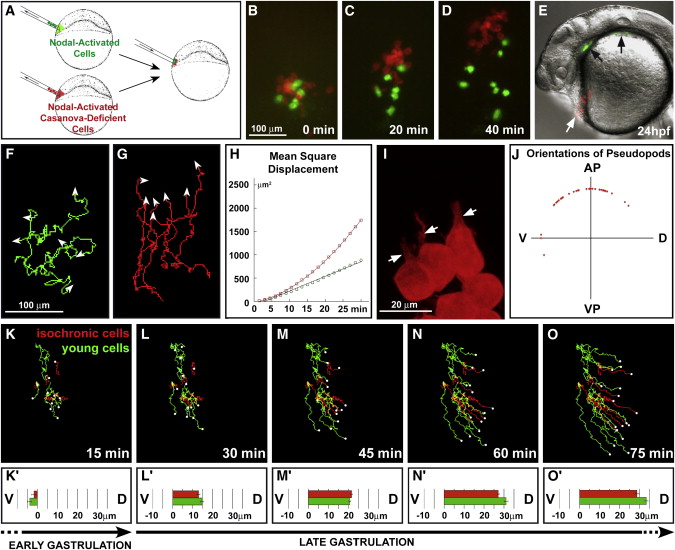
Fig. 2 Control of Random Walk Behavior (A?J) Random walk is inducible by Nodal and depends on casanova. In (A), a schematic of the experimental procedure is illustrated. (B?D) Nodal-activated cells (green, Tar* cells) and Nodal-activated cells coinjected with a morpholino against casanova (red, Tar*-MOcasanova cells) were transplanted into wild-type host embryos and monitored during early gastrulation. (E) At 24 hpf, Tar* cells are found within the endoderm (pharynx, black arrows), whereas Tar*-MOcasanova cells contribute to the hatching gland (white arrow). (F and G) Shown are representive examples of 40 min tracks with 1 min intervals of Tar* and Tar*-MOcasanova cells after transplantation. (H) A MSD plot reveals that Tar* cells (green) migrate in a random walk (linear fit, R = 0.996), whereas Tar*-MOcasanova cells (red) display an oriented migration (parabolic fit, R = 0.999). For each population, 30 cells from four embryos were analyzed. (I) Shown is a representive example of Tar*-MOcasanova cell morphology during early gastrulation. Cells develop large cytoplasmic processes (white arrows). In (J), a polar plot illustrates the distribution of the outgrowth positions of pseudopods relative to the cell center of Tar*-MOcasanova cells during early gastrulation. Seventeen cells from three embryos were analyzed over 20 min. (K?O′) Transition to a convergence movement is induced by the embryonic environment. Nodal-activated cells from midblastula (4 hpf) embryos (young cells, green) and late-blastula (5 hpf) embryos (isochronic cells, red) were transplanted into late-blastula (5 hpf) host embryos. Shown is a representative example of four independent experiments. (K?O) Shown are tracks of both cell populations after 15, 30, 45, 60, or 75 min of monitoring. Host midgastrulation (70% epiboly) corresponds to t = 15 min. The white dots indicate the end position of each track. (K′)?(O′) illustrates the mean net displacement toward the dorsal side for each 15 min interval. During host early gastrul2870% epiboly) corresponds to t = 15 min. The white dots indicate the end position of each track. (K′)?(O ion, both cell populations first migrate randomly without any dorsal bias (K′). They simultaneously start to converge dors
Image
Figure Caption
Acknowledgments
This image is the copyrighted work of the attributed author or publisher, and
ZFIN has permission only to display this image to its users.
Additional permissions should be obtained from the applicable author or publisher of the image.
Full text @ Curr. Biol.

