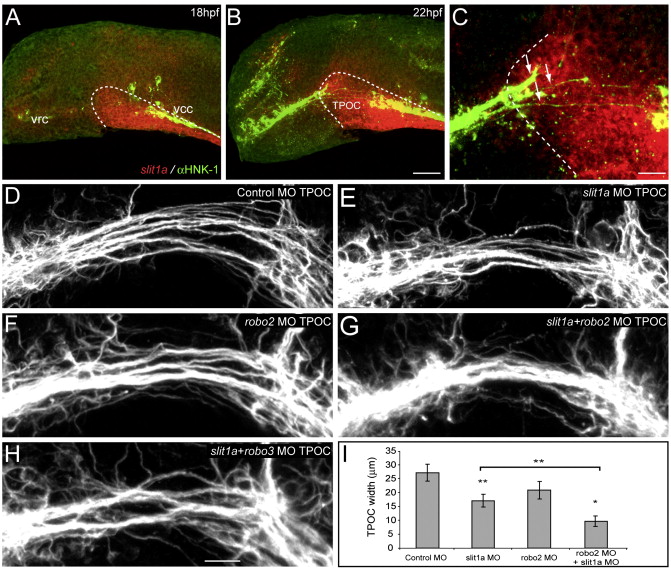
Fig. 5 Slit1a is the putative Robo2 ligand in the TPOC. (A?C) The spatiotemporal expression pattern of slit1a suggests a role in the guidance of axons in the TPOC. At 18 hpf, slit1a is first observed at the ventral midline and in a broad domain of neuroepithelium through which the TPOC projects (A, dashed line). This expression is still present at 22 hpf (B). The rostral limit of slit1a expression (C, dashed line) coincides with the point at which the TPOC splits from a single bundle of axons into a number of distinct fascicles (C, arrows). (D?I) Lateral view of the TPOC at 28 hpf labeled with acetylated α-tubulin. Rostral is to the left, dorsal is to the top. (D) The TPOC developed normally following injection of standard control MO (10 ng). By contrast, injection of 2.5 ng of slit1a MO1 led to a significant reduction in the width of the TPOC (E), similar to that observed following knockdown of robo2 (F). (G) The TPOC appears as a single thick bundle of axons following coinjection of slit1a MO1 and robo2 MO2 (1 ng and 2 ng of each MO respectively, 3 ng total). (H) The TPOC phenotype of slit1a + robo3 loss-of-function embryos was similar to that obtained following knockdown of slit1a (E). (I) Average TPOC width measurements were analyzed using ANOVA, followed by the Tukey HSD test. Values represent the mean ± SD. **P < 0.0001, *P < 0.01. Scale bar: A, B: 50 μm; C: 25 μm; D?H: 20 μm.
Reprinted from Developmental Biology, 313(1), Devine, C.A., and Key, B., Robo-Slit interactions regulate longitudinal axon pathfinding in the embryonic vertebrate brain, 371-383, Copyright (2008) with permission from Elsevier. Full text @ Dev. Biol.

