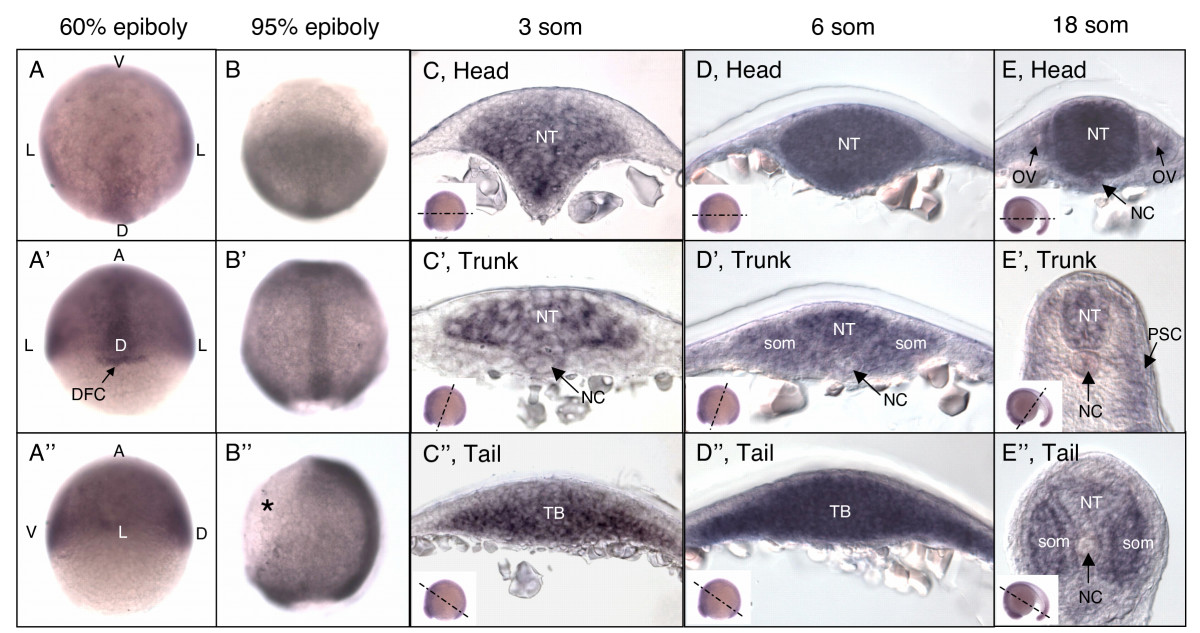
Fig. 5 Expression of N-cadherin during gastrulation and somitogenesis. N-cadherin mRNA expression in WT, 60% epiboly (A-A″), 95% epiboly (B-B″), 3 som (C-C″), 6 som (D-D″), and 18 som (E-E″) embryos. Animal views (A,B), dorsal views (A′,B′), and sagital views (A″,B″). Asterisk indicates lack of N-cad expression in the ventral epidermis. (C-E″) Cross-sections through the head (C,D,E), trunk (C′,D′,E′), and tail (C″,D″,E″) regions. Insets indicate the angle at which the embryo was sectioned. Abbreviations: V, ventral; L, lateral; D, dorsal; A, animal; NT, neural tube; NC, notochord; som, somite; TB, tailbud; OV, otic vessicle; PSC, postmigratory slow cells.
Image
Figure Caption
Figure Data
Acknowledgments
This image is the copyrighted work of the attributed author or publisher, and
ZFIN has permission only to display this image to its users.
Additional permissions should be obtained from the applicable author or publisher of the image.
Full text @ BMC Dev. Biol.

