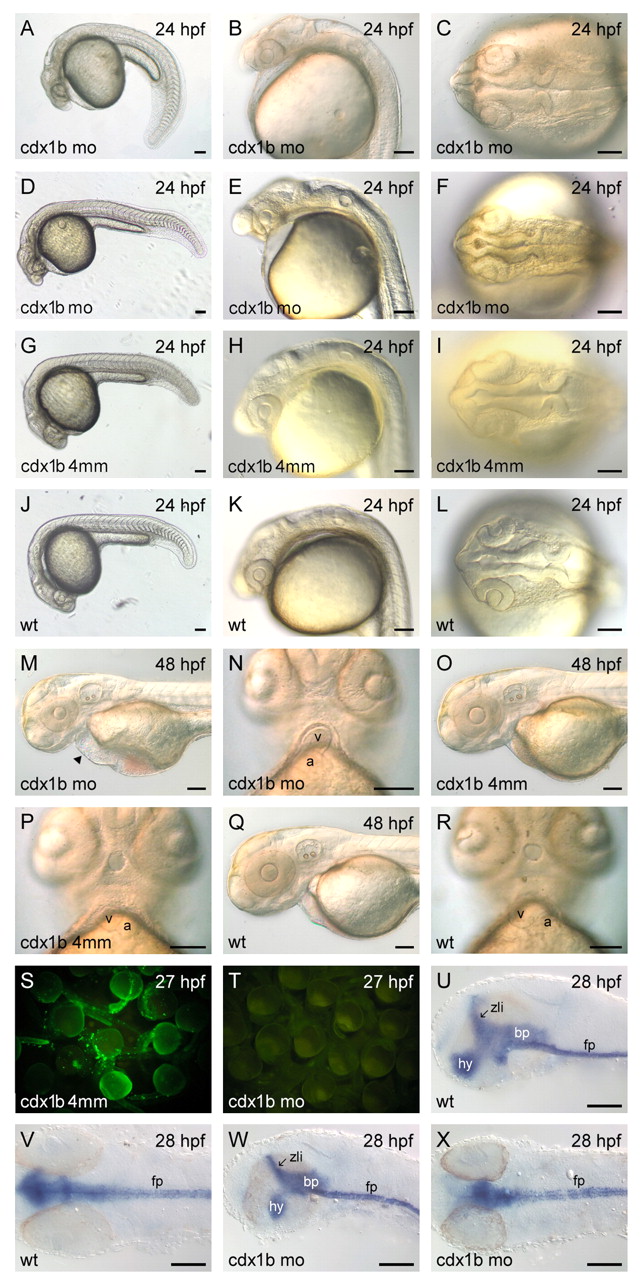
Fig. 2 cdx1b antisense MO knockdown analyses. cdx1b 24 hpf (A-F) and 48 hpf (M,N) zebrafish morphants; cdx1b-4mm-MO-injected 24 hpf (G-I) and 48 hpf (O,P) embryos; wild-type 24 hpf (J-L) and 48 hpf (Q,R) embryos. Green fluorescence was not detected in cdx1b MO and CMV-cdx1b-mo-GFP co-injected (T) 27 hpf embryos, whereas bright green fluorescence was detected in cdx1b-4mm MO and CMV-cdx1b-mo-GFP co-injected embryos (S). The expression patterns of shh were compared in 28 hpf wild type (U,V) and morphants (W,X). Scale bars: 100 μm. a, atrium; bp, basal plate midbrain; fp, floor plate; hy, hypothalamus; v, ventricle; wt, wild type; zli, zona limitans intrathalamica.
Image
Figure Caption
Figure Data
Acknowledgments
This image is the copyrighted work of the attributed author or publisher, and
ZFIN has permission only to display this image to its users.
Additional permissions should be obtained from the applicable author or publisher of the image.
Full text @ Development

