
Image
|
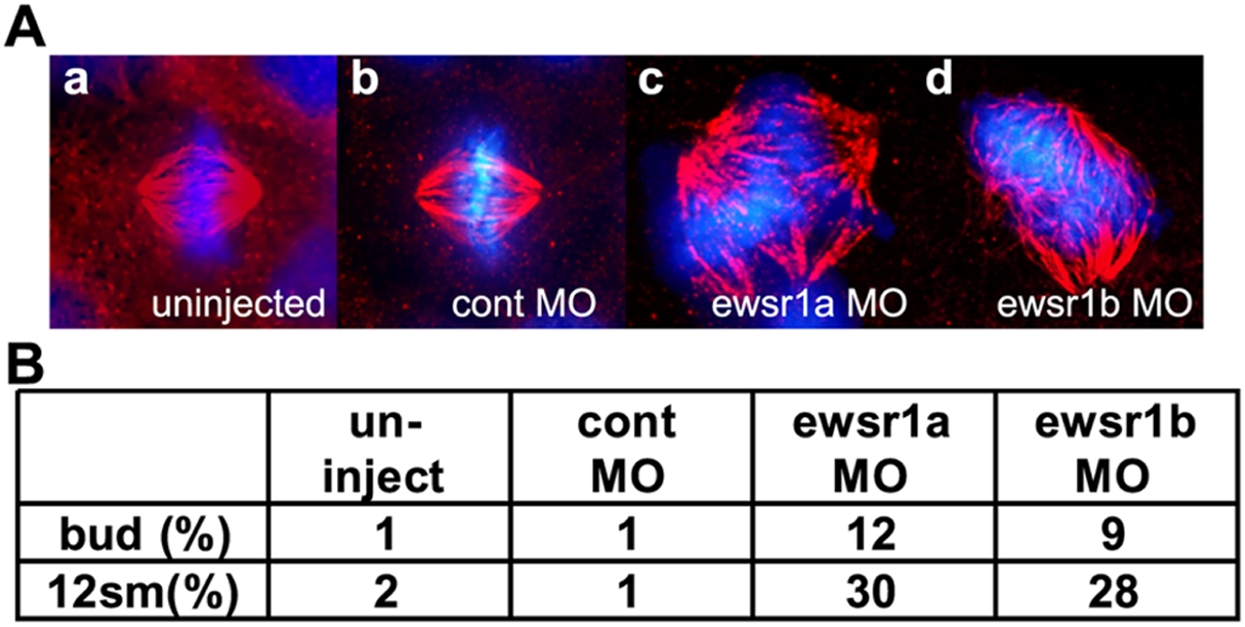
Figure Caption
Fig. 7 ewsr1 MO Injected Zebrafish Embryos Display Mitotic Defects. A. Representative images of mitotic spindles from (a) uninjected, (b) control MO, (c) ewsr1a MO and (d) ewsr1b MO injected embryos. DNA was stained with DAPI (blue) and the spindles were visualized by α-tubulin staining (red). B. Score of abnormal mitotic spindles of uninjected, control MO, ewsr1a MO and ewsr1b MO injected embryos at the bud and the 12 somite stages (12sm). Approximately two hundred mitotic spindles (N = 193?234) were examined for each group.
Figure Data
Acknowledgments
This image is the copyrighted work of the attributed author or publisher, and
ZFIN has permission only to display this image to its users.
Additional permissions should be obtained from the applicable author or publisher of the image.
Full text @ PLoS One