
|
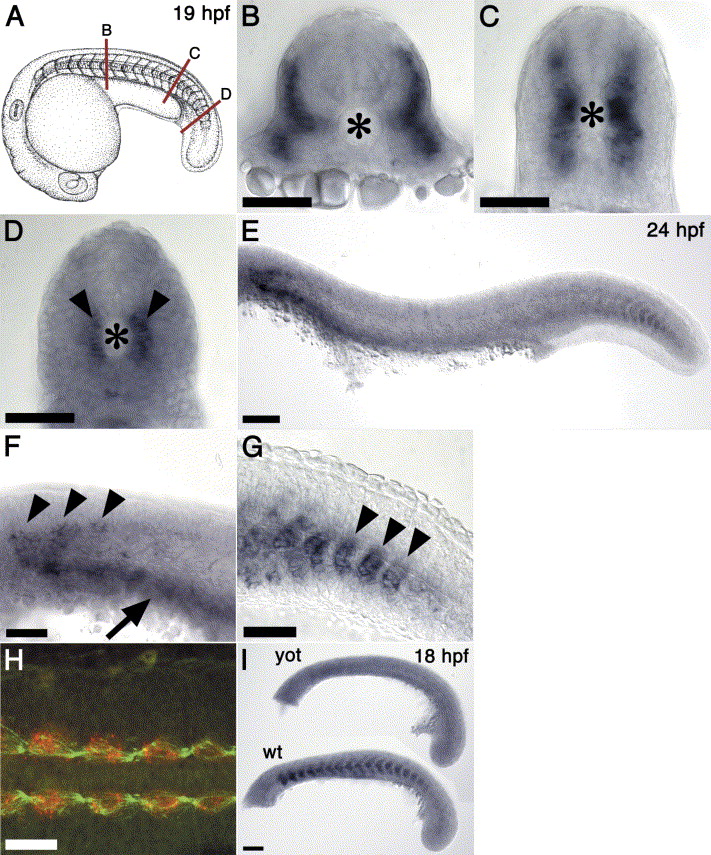
Fig. 2 Expression of sema3G in the somites. (A) Diagram of zebrafish embryo at 19 hpf, showing locations of the cross-sections through the anterior (B), posterior (C), and tail (D) somites. (B) In the anterior trunk somites sema3G is expressed in the cells at the lateral somite surface. (C) In the posterior trunk somites sema3G is expressed in cells adjacent to the neural tube and notochord. (D) In the tail, sema3G is expressed in a column of somite cells adjacent to the notochord (arrowheads). (E) Lateral view at 24 hpf showing that sema3G first diminishes in the central trunk region. (F and G) Higher magnification images of embryo in (E), showing sema3G expression remains in the anterior somites (arrowheads in F) and in the new somites of the tail (arrowheads in G). Arrow in (F) indicates out-of-focus labeling of the pronephros along the yolk. (H) Confocal projection (dorsal view) of embryo at 18 hpf, double-stained for sema3G mRNA (red) and F59 antibody (green), which stains myosin heavy chain isoforms in fish. (I) Lateral views of the trunk of yot (top) and wild type embryos (bottom) at 18 hpf. yot embryos do not express sema3G in the trunk. Asterisk: notochord. Scale bar in panels B–D and F–H=50 μm. Scale bars in E and I=100 μm.
Reprinted from Gene expression patterns : GEP, 5(5), Stevens, C.B., and Halloran, M.C., Developmental expression of sema3G, a novel zebrafish semaphorin, 647-653, Copyright (2005) with permission from Elsevier. Full text @ Gene Expr. Patterns