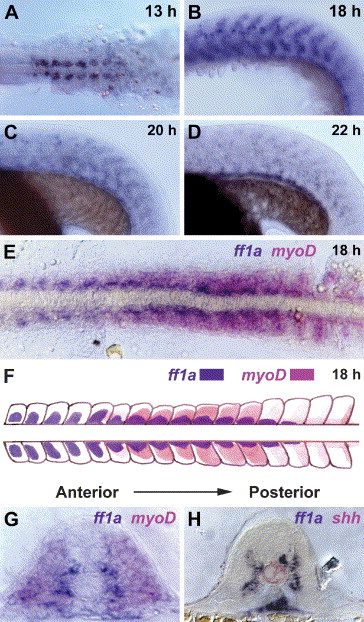
Fig. 1 Expression profile of ff1a during early somitogenesis. (A–E) In situ hybridization of ff1a, with anterior to the left. (A) ff1a transcripts are first localized as bilateral cells on either side of the notochord at 13 h, dorsal view. (B–F) Lateral view. (B) ff1a transcripts are most abundant at 18 h in anterior somites and in the neural tube (arrows). (C) After the mid-segmentation stage, ff1a expression is down-regulated from the anterior somites, but expression at the neural tube remains visible at 20 h. (D) ff1a expression is very weak even from posterior somites at 22 h. (E) When compared to myoD expression pattern (pink color), ff1a (blue) is expressed in the adaxial cells of newly formed somites and gradually migrates out to the periphery. The dotted line represents the position of the cross-sections shown in panels (G, H). (F) A cartoon drawing of panel (E). (G) Cross-sections of double in situ with ff1a (blue) and myoD (pink). (H) Cross-sections of double in situ with ff1a (black) and shh (pink).
Reprinted from Developmental Biology, 286(2), Sheela, S.G., Lee, W.C., Lin, W.W., and Chung, B.C., Zebrafish ftz-f1a (nuclear receptor 5a2) functions in skeletal muscle organization, 377-390, Copyright (2005) with permission from Elsevier. Full text @ Dev. Biol.

