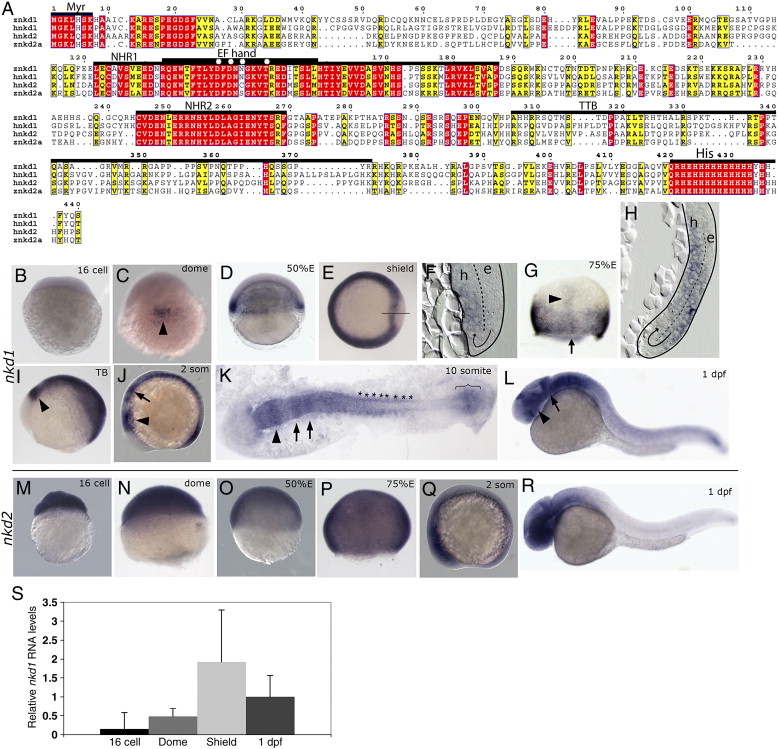
Fig. 1 Alignment and expression of zebrafish nkd1 and nkd2. (A) Alignment of zebrafish Nkd1 and Nkd2a amino acid sequence with human Nkd1 and Nkd2. Red boxes identify identical residues, while yellow boxes identify similarities. Numbering refers to the amino acid sequence of zebrafish Nkd1. Overlying bars define the different conserved domains. Myr, myristoylation sequence; NHR1, naked homology region 1; EF hand, identifies the homologous region in D. melanogaster Nkd that is predicted to bind zinc. The zinc-binding residues are denoted with an asterisks according to Zeng et al. (2000); NHR2, naked homology region 2; TTB, TGFα tail binding domain that is found in human Nkd2 (Li et al., 2004); His, Histidine rich domain. (B?L) Whole-mount in situ hybridization analysis of nkd1 expression. (B) nkd1 expression is not detected in 16 cell stage, Pre-MBT embryos. (C) Expression of nkd1 is detected in the presumptive organizer region (arrowhead) at dome stage. (D) At 50% epiboly, nkd1 expression is in the entire blastoderm margin and by shield stage is reduced in the shield (E), only to be turned on in the axial mesendoderm (F). The solid line through the shield marks the plane of section shown in panel F. In panels F and H, the dashed line demarcates the ectodermal epiblast (e) and the mesendodermal hypoblast (h) layers and the arrow depicts route of cell movements during internalization. (G) At 75?80% epiboly, expression is observed in the margin and in the axial mesendoderm (arrowhead). The arrow identifies the plane of section in panel H. (I) Tailbud (TB) stage. Mid-hindbrain boundary (mhb) is identified with an arrowhead. (J) In early somitogenesis, arrowhead identifies the mhb and the arrow is pointing to segmented expression in the hindbrain. (K) 10 somite stage, expression is observed in the mhb (arrowhead), hindbrain (arrows), developing somites (*) and in the presomitic mesoderm (bracket). (L) At 1 dpf, expression continues in the mhb (arrow) but is now also observed in the developing eye (arrowhead). (M?R) Whole-mount in situ analysis of nkd2 expression. (M?Q) nkd2 expression is ubiquitous. At 1 dpf, expression is confined to the anterior CNS and the posterior tail. (M) 16 cell stage; (N) dome stage; (O) 50% epiboly; (P) 75?80% epiboly; (Q) early somitogenesis stage; (R) 1 dpf. (S) Relative RNA levels determined by qRT-PCR for nkd1. Levels are normalized to 1 dpf (16 cell = 0.15±0.43; Dome = 0.48±0.21; Shield = 1.92 ± 1.37; 1 dpf = 1±0.56). Error bars represent standard deviation. (B, M, N) lateral view, animal pole is to the top; (C, G, N, P) dorsal view, animal pole to the top; (D, O) lateral view, dorsal is to the right, animal pole to the top; (E) animal pole view, dorsal is to the right; (I, J, L, Q, R) lateral view, anterior is to the left; (K) flat mount view, anterior is the to the left. (F, H) Sagittal sections through regions identified in panel E (line) and panel G (arrow).
Reprinted from Developmental Biology, 309(2), Van Raay, T.J., Coffey, R.J., and Solnica-Krezel, L., Zebrafish Naked1 and Naked2 antagonize both canonical and non-canonical Wnt signaling, 151-168, Copyright (2007) with permission from Elsevier. Full text @ Dev. Biol.

