
|
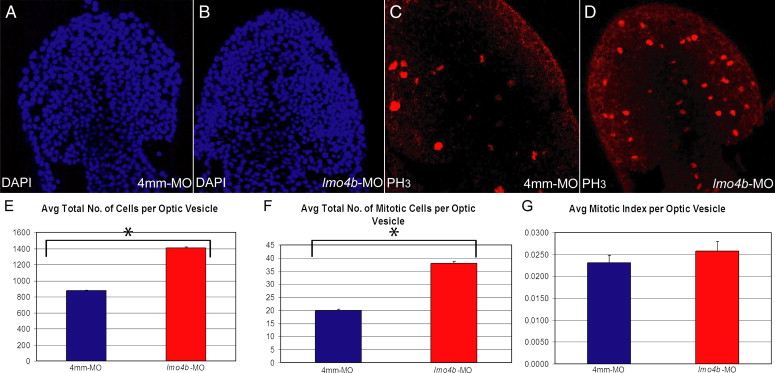
Fig. 6 Loss of lmo4b results in higher average total cell nuclei and mitotic cell counts in the optic vesicle. Panels A–D are dorsoanterior views of 7s stage embryos injected with 4 ng of 4 mm-MO (A, C) and 4 ng of lmo4b-MO (B, D). Panels E-G are graphical representations of average total cell nuclei count (E), average total mitotic cell count (F) and average mitotic index (G) per optic vesicle. Individual values with confidence intervals for control and morphants, respectively are: E = 877 ± 14 and 1410 ± 30. F = 20 ± 1 and 58 ± 1. G = 2.3 x 10- 2±1.1 x 10- 3 and 2.6 x 10- 2±1.3 x 10- 3. p values are indicated in the text. n of lmo4b morphant optic vesicles = 13; n of control optic vesicles = 6. Error bars represent S.E.M.
Reprinted from Developmental Biology, 309(2), McCollum, C.W., Amin, S.R., Pauerstein, P., and Lane, M.E., A zebrafish LMO4 ortholog limits the size of the forebrain and eyes through negative regulation of six3b and rx3, 373-385, Copyright (2007) with permission from Elsevier. Full text @ Dev. Biol.