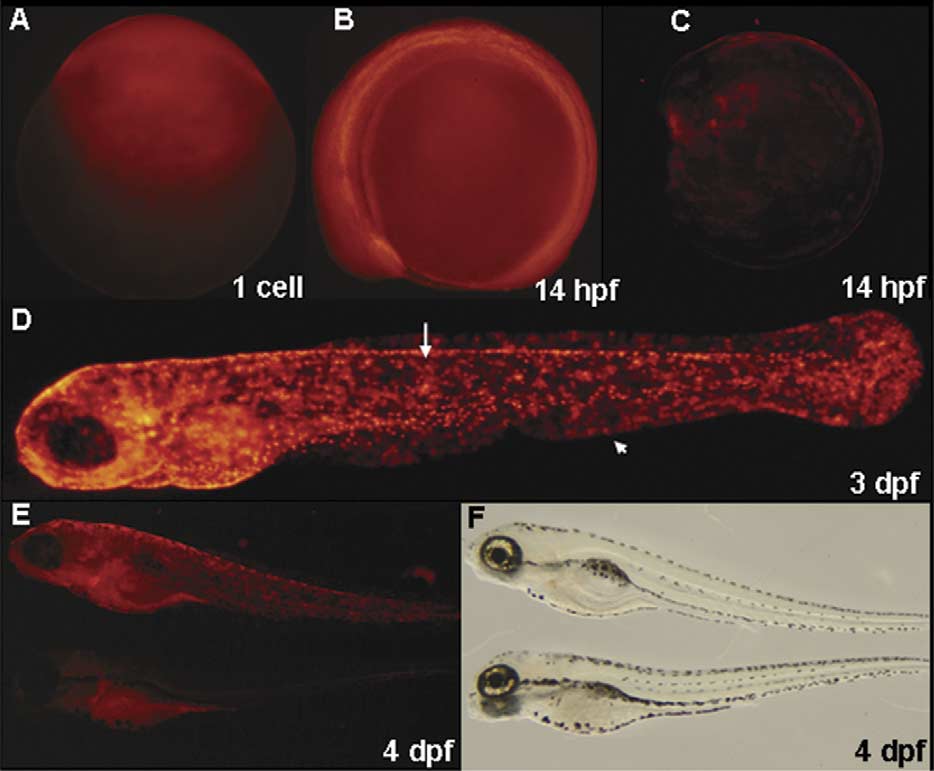
Fig. 2 Red fluorescent protein (RFP) expression of the transgenic fish lines during early embryogenesis. The F2 offspring were produced by mating F1 female from Tg(k18(2.9):RFP) line with wild-type males (A, B, D, E) or by mating the F1 males from the Tg(k18(2.9):RFP) with wild-type females (C). (A) At the one-cell stage. (B) At 14 h postfertilization (hpf). (C) At 14 hpf. (D) At 3 days postfertilization (dpf); the arrows and arrow head indicate two different shapes of epithelial cells. (E) At 4 dpf, the red signals were gradually abolished to the undetectable level (upper). However, some of them still displayed red fluorescence (bottom). (F) Observation under the light field.
Reprinted from Gene expression patterns : GEP, 6(4), Wang, Y.H., Chen, Y.H., Lin, Y.J., and Tsai, H.J., Spatiotemporal expression of zebrafish keratin 18 during early embryogenesis and the establishment of a keratin 18:RFP transgenic line, 335-339, Copyright (2006) with permission from Elsevier. Full text @ Gene Expr. Patterns

