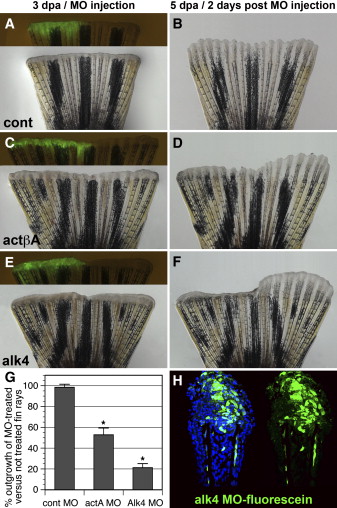
Fig. 4 Morpholino-Mediated actA and alk4 Knockdowns Impair Fin Regeneration (A?F) Fins microinjected on one side with control (A and B), actA (C and D), and alk4 (E and F) fluorescein-tagged MOs and then electroporated. Bright-field and fluorescent images show fins at 3 dpa shortly after MO delivery to the regenerate (A, C, and E). Fluorescent MOs (green) are seen only in the injected half of the fin. The remaining noninjected half of the fin served an internal control for the growth rate. Corresponding images of the fins 2 days after MO delivery (5 dpa) are shown (B, D, and F). The control MO does not affect the size of the outgrowth relative to the noninjected side of the fin (B). The actβA and alk4 MOs impair the growth of the injected fin relative to the noninjected side, leading to the asymmetric shape of the regenerate (D and F). (G) Graph comparing the length of regenerates that regrew within 2 days after MO delivery in relation to the nontreated fin regenerate. It depicts the percent length of the outgrowth of the experimental side in relation to the control side (ten fins were analyzed, five of which were either ventrally or dorsally injected). Error bars represent the SEM. The asterisks denote the significant difference, p < 0.005. (H) Longitudinal section of the fin at 2 days after the alk4 fluorescent MOs delivery (5 dpa). Fluorescent (green) cells are identified in the epidermis and within the mesenchymal tissue distal to the amputation plane, indicating the efficiency of MO incorporation. DAPI in blue labels all nuclei.
Image
Figure Caption
Figure Data
Acknowledgments
This image is the copyrighted work of the attributed author or publisher, and
ZFIN has permission only to display this image to its users.
Additional permissions should be obtained from the applicable author or publisher of the image.
Full text @ Curr. Biol.

