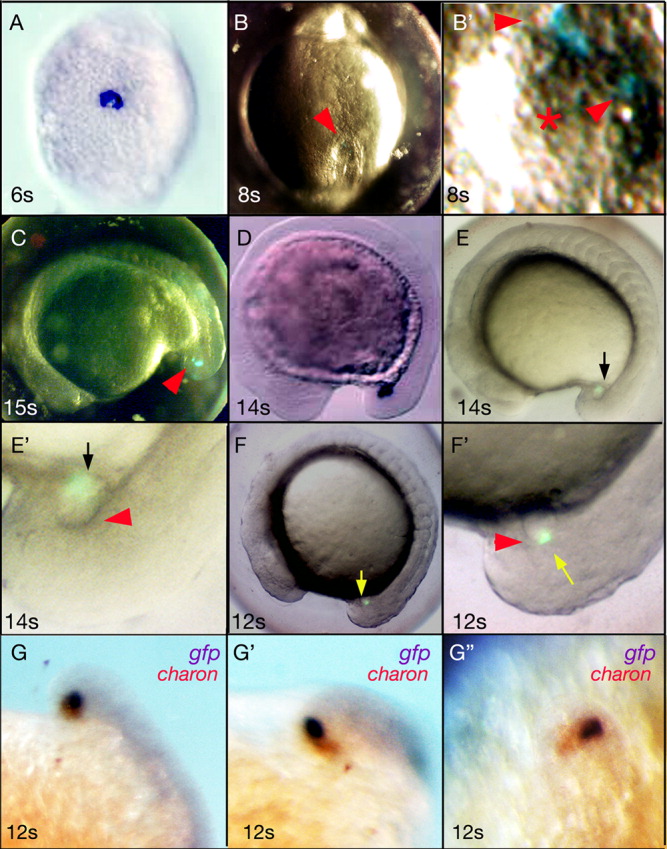
Fig. 5 The chaTBE fragment drives KV expression of a GFP reporter. A,D: Endogenous charon expression. Reproduced from Hashimoto et al. ([2004]) with permission of the publisher. A: Six s embryo, vegetal view. D: Fourteen s, lateral view. Head to left. B, B′, C: Various views of the same pchaTBEd2eGFP-injected embryo. B: Eight s Bright field + fluorescence. Vegetal view. Red arrowhead points to Kupffer′s Vesicle (KV). B′: An enlarged image of the KV region of B. Red asterisk marks KV center. Red arrowheads point to d2eGFP-positive cells. C: Same embryo at 15 s. Head to left. Bright field + fluorescence. Red arrowhead: d2eGFP expression like cha (5D). E/E′, F/F′: Two pchaTBEd2eGFP-injected embryos from a separate experiment from that shown in B,C. Lateral view with superimposed bright field plus fluorescence. Yellow and black arrows: GFP fluorescence. Red arrowhead: KV. E: Fourteen-somite s. E′: Same embryo as in E. Enlarged view of tailbud/KV region. F: Twelve-somite s. F′: Same embryo as in F. Enlarged view of tailbud/KV region. G, G′, G′: Tailbud/KV region of a pchaTBEd2eGFP-injected embryo at 12 somites, shown in lateral, tilted, and dorsal views, respectively. Two-color RNA in situ with Dig-gfp and DNP-charon probes. In this embryo, the gfp (BM Purple) signal overlaps with the left half of the endogenous charon mRNA domain (INT Red/BCIP).
Image
Figure Caption
Figure Data
Acknowledgments
This image is the copyrighted work of the attributed author or publisher, and
ZFIN has permission only to display this image to its users.
Additional permissions should be obtained from the applicable author or publisher of the image.
Full text @ Dev. Dyn.

