
|
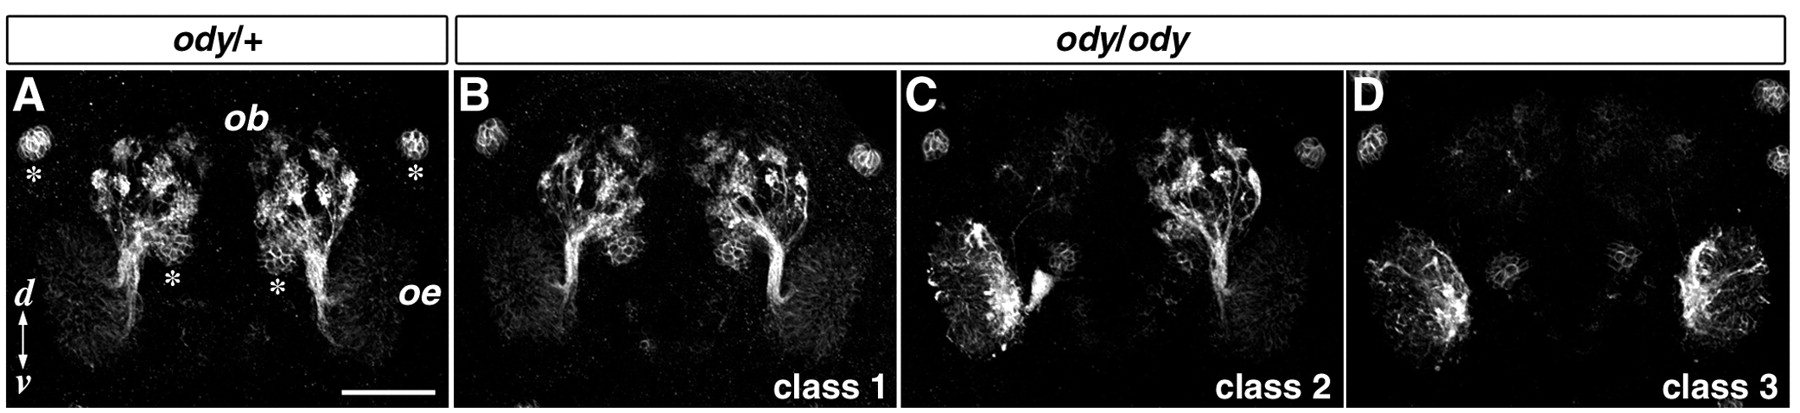
Fig. 7 Zebrafish ody mutant embryos show OSN axon projection defects. (A-D) Axon trajectories from both ciliated and microvillous OSNs are labeled at 3 dpf by whole-mount immunohistochemistry with anti-PCAM antibody, and are shown in frontal views as z-stacked images. ody/ody embryos are classified into three groups according to the severity of axon pathfinding defects (B-D): class 1 (8 of 18 embryos), a virtually wild-type projection pattern; class 2 (5 of 18), unilatetal projection defects; class 3 (5 of 18), bilateral projection defects. Projection patterns of all ody/+ embryos (n=15) fall into class 1. Asterisks in A indicate neuromasts in the lateral line system. Scale bar: 100 µm. d, dorsal; ob, olfactory bulb; oe, olfactory epithelium; v, ventral.