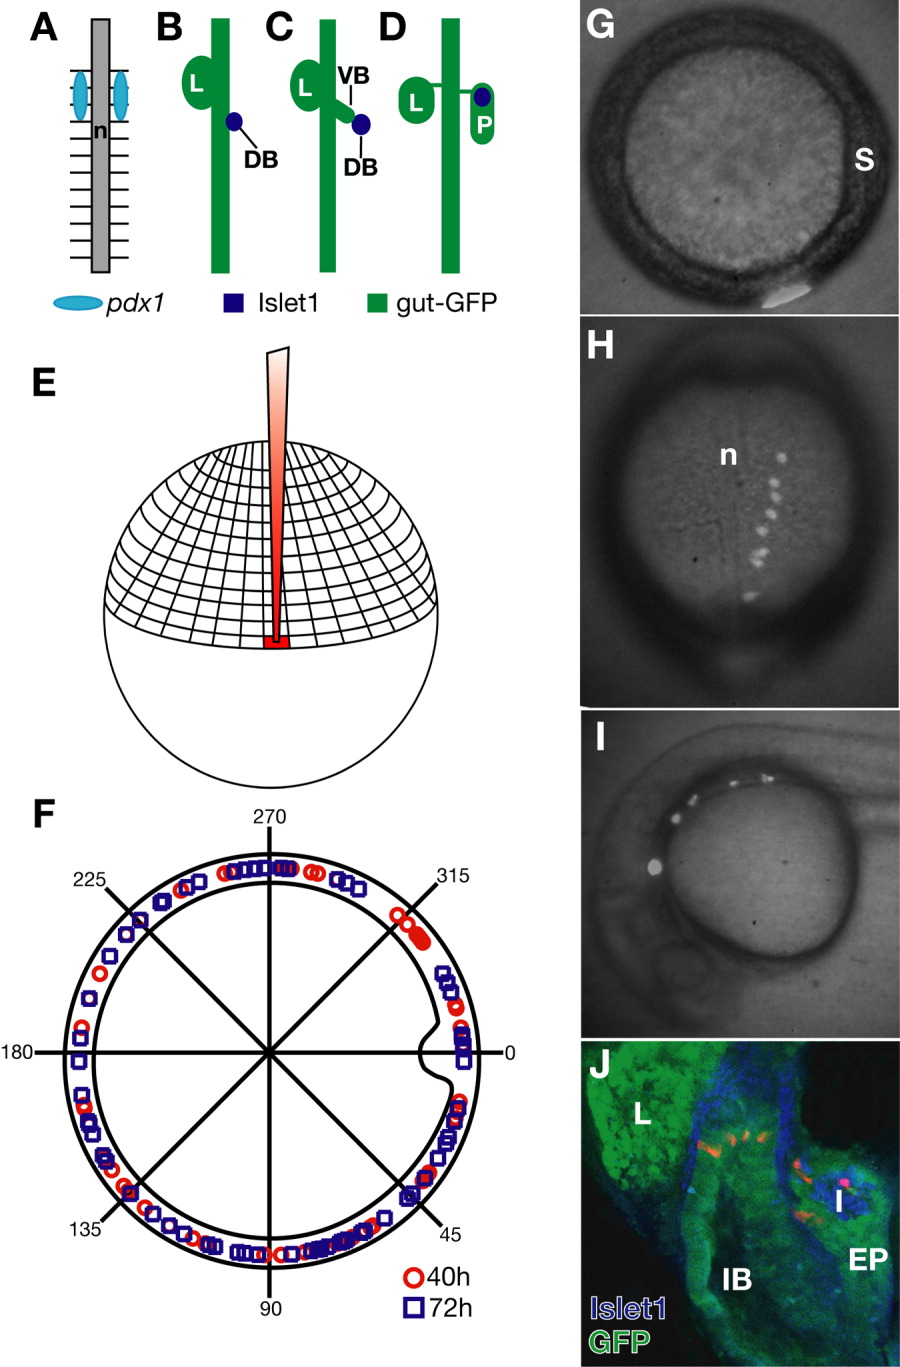
Fig. 1 Development of the pancreas in zebrafish and general fate map methodology. A: pdx1 is expressed bilaterally adjacent to the notochord of the anterior trunk at 14 hours postfertilization (hpf; based on Biemar et al.,[2001]). B-D: Morphogenesis of the pancreatic buds in zebrafish (based on Field et al.,[2003]). B: 24 hpf. The posterodorsal bud is visible. C: At 40 hpf. Both posterodorsal and anteroventral buds are visible, but have not fused. D: At 52 hpf. The buds have fused. E: One marginal blastomere was injected at the 512- to 2000-cell stage. F: Location of injected cells that gave rise to endoderm. Red circles were locations for the 40 hpf analysis, and blue squares were for the 72 hpf analysis. G-J: Embryos were imaged at various time points using brightfield and fluorescence, and photos were merged. G: At 6 hpf. H: At 10 hpf. I: At 24 hpf. J: Dorsal view of 72 hpf embryo showing rhodamine dextran-labeled cells in the exocrine and endocrine pancreas. Anti-Islet1 (blue) labels the endocrine pancreas and anti-green fluorescent protein (GFP; green) labels the postpharyngeal endoderm in gut-GFP embryos. DB, posterodorsal pancreatic bud; EP, exocrine pancreas; I, pancreatic islet; IB, intestinal bulb; L, liver; N, notochord; P, pancreas; S, embryonic shield; VB, anteroventral pancreatic bud.
Image
Figure Caption
Figure Data
Acknowledgments
This image is the copyrighted work of the attributed author or publisher, and
ZFIN has permission only to display this image to its users.
Additional permissions should be obtained from the applicable author or publisher of the image.
Full text @ Dev. Dyn.

