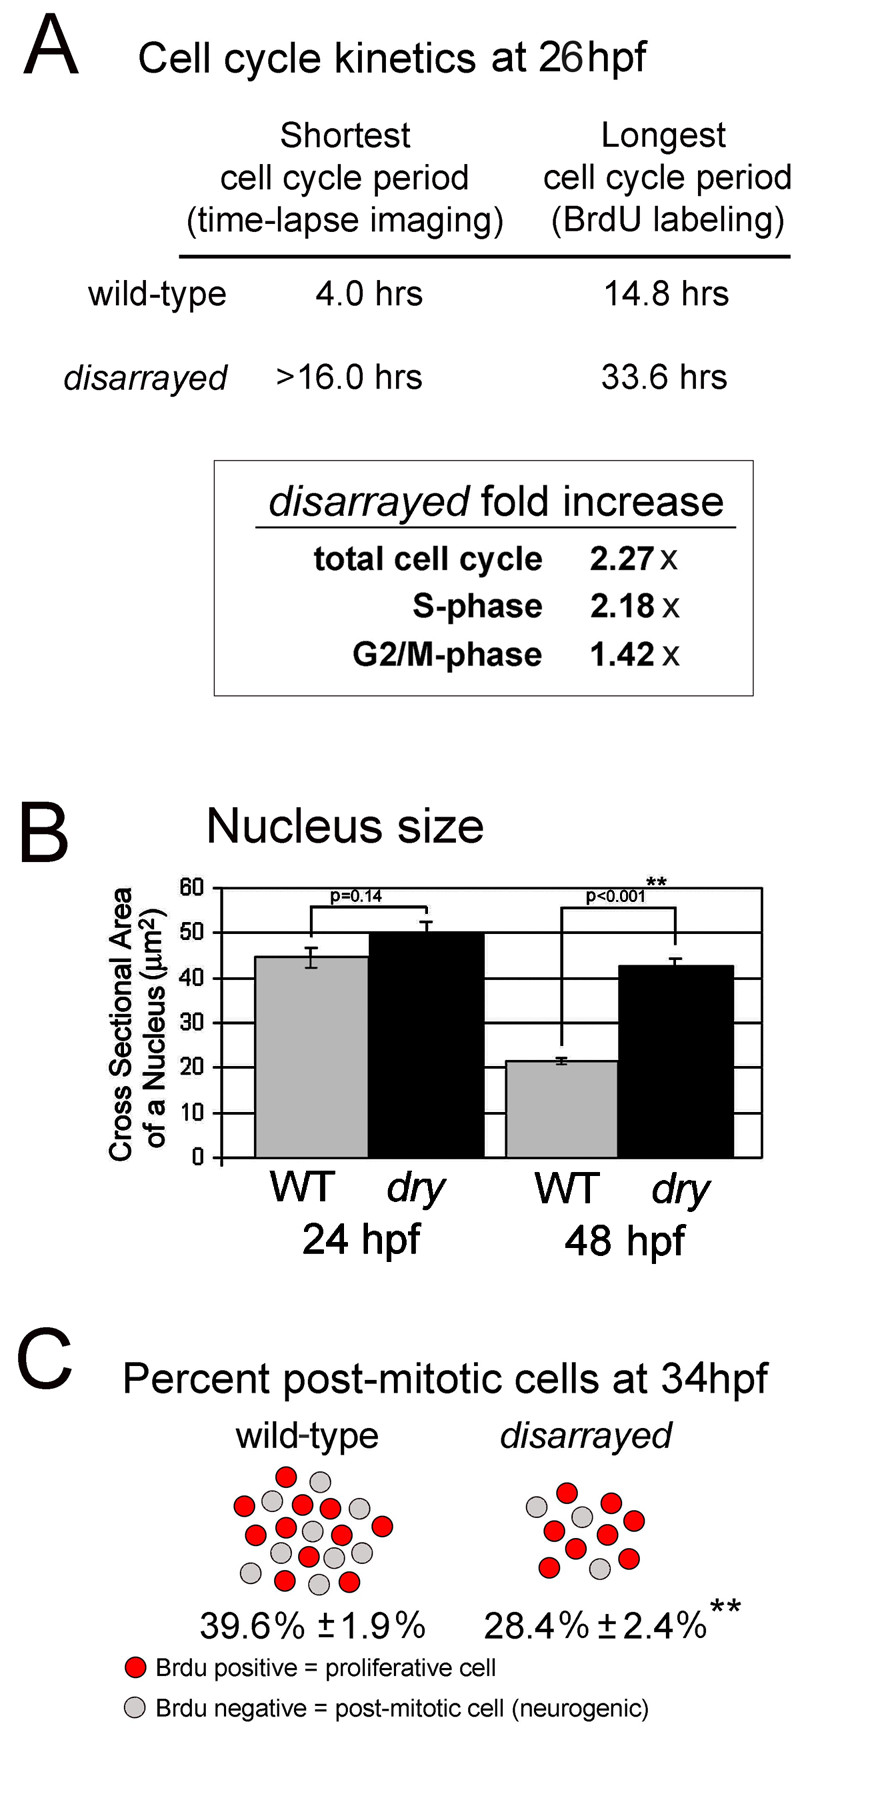
Fig. 5 Extended cell cycle and reduced rate of retinal neurogenesis in disarrayed. (A) Cell cycle kinetics at 26 hpf as determined using either direct time-laspse imaging or Cumulative BrdU Labeling with Labeled Mitosis methods. The total cell cycle period as well as S-phase and G2+M-phases were significantly extended at 28 hpf in disarrayed retinas, as indicated by fold increase compared to wild-type siblings. (B) Nucleus size in wild-type (WT, grey) or disarrayed (dry, black) retinal progenitors at 24 and 48 hpf. (C) Comparison of the proportion of proliferative cells (red) to total cells (red + grey) which exited that cell cycle from 28?34 hpf in wild-type and disarrayed embryos. In mutant eyes there are fewer total cells (216.2 +/- 8.4 vs. 383.1 +/- 15.0; n = 15 and n = 14 respectively) and a lower percentage that have exited the cell cycle by 34 hpf (average +/- SE, n = 18 (WT) and n = 11(dry)). ** p d 0.001 (Student′s t-test).
Image
Figure Caption
Figure Data
Acknowledgments
This image is the copyrighted work of the attributed author or publisher, and
ZFIN has permission only to display this image to its users.
Additional permissions should be obtained from the applicable author or publisher of the image.
Full text @ BMC Dev. Biol.

