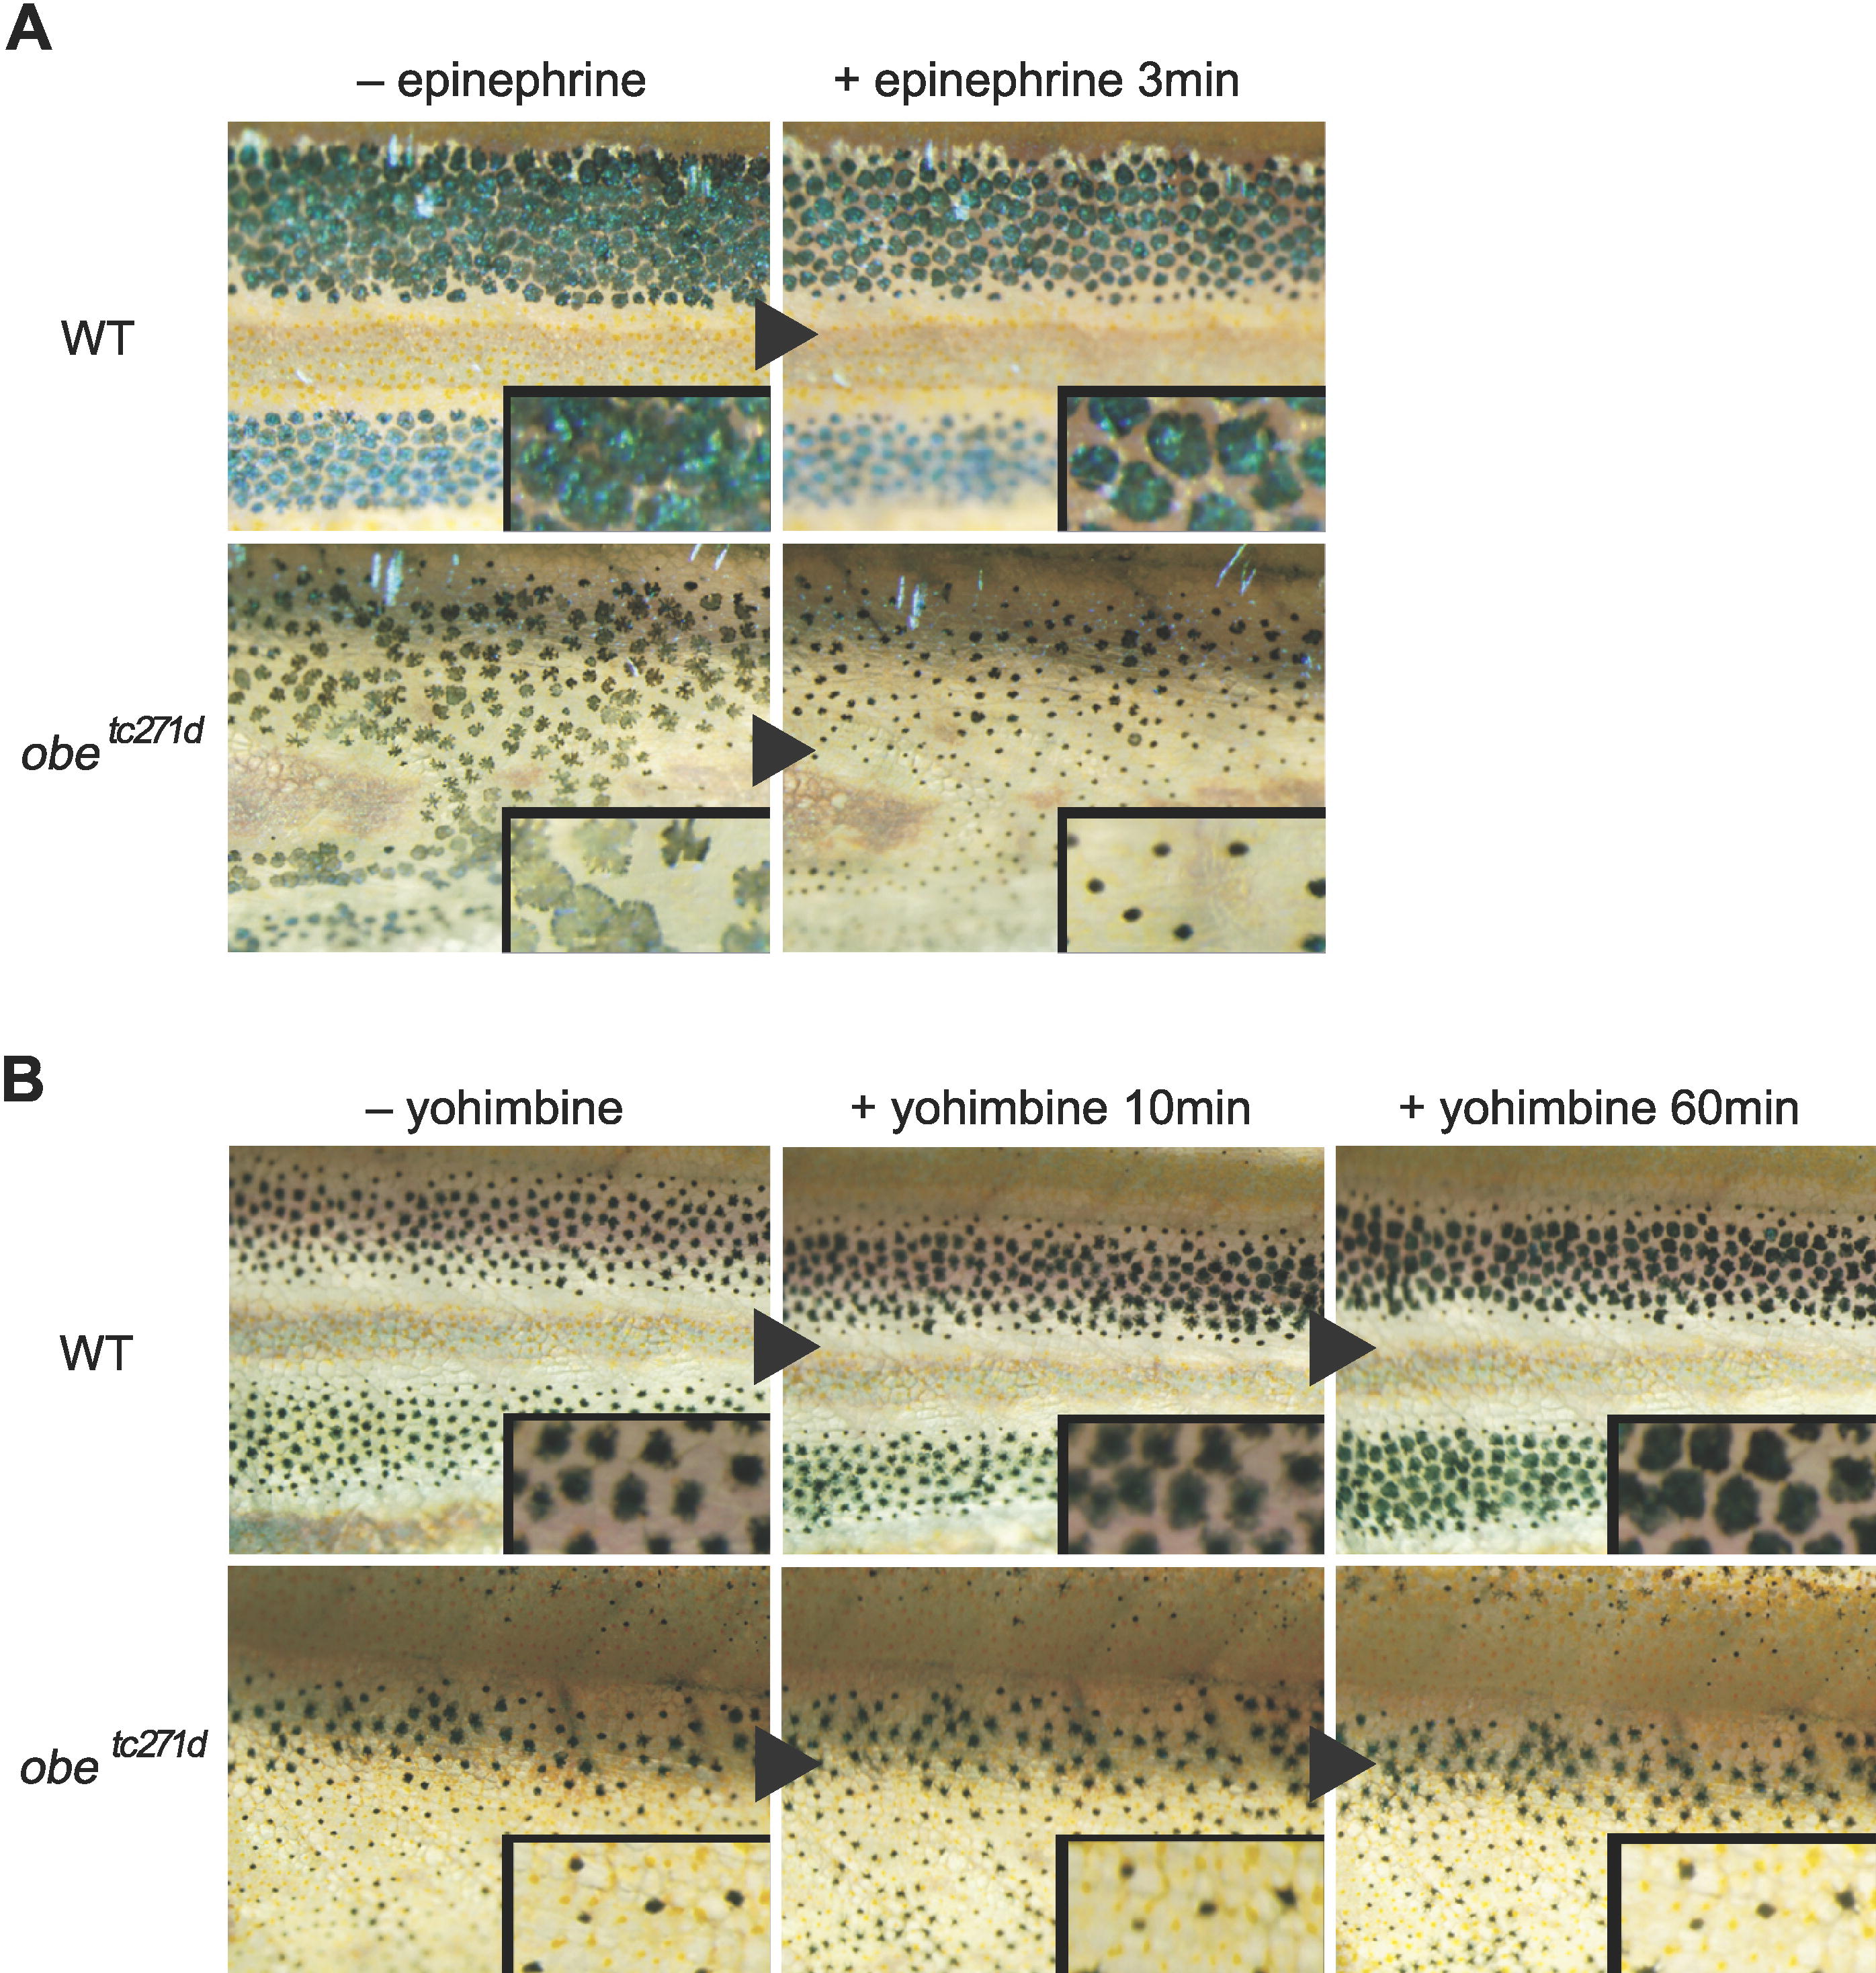
Fig. 6 Melanophore Response to an α2-Adrenoceptor Agonist or Antagonist. Melanophore response to the agonist epinephrine. Fish were placed in black backgrounds for the duration of the experiment to block the endogenous aggregation signal from sympathetic nerves. The upper panels show the responses of melanophores in the trunk of wild-type fish (WT), and the lower panels show that of mutant fish (obetc271d). Melanophores of wild-type (n = 6) and mutant fish (jagb230 and obetc271d) (n = 12, for all) showed melanosome aggregation when epinephrine was added in the breading water, although the extent of aggregation in the mutant melanophores appeared to be more pronounced than in the wild-type. (B) Melanophore response to the antagonist yohimbine. All fish were kept in an environment with a white background for several minutes (approximately 10 min) prior to addition of antagonist (left panels) and for the duration of the experiment to block endogenous dispersion. The upper panels show the responses of melanophores in the trunk of wild-type (WT) fish, and the lower panels show that of mutant fish (obetc271d). Melanosomes of wild-type fish dispersed after adding the antagonist, because the antagonist blocks the endogenous aggregation signal (middle and right panels) (n = 7). However, in mutant fish (jagb230 and obetc271d), many of the melanophores remained aggregated for a long time (longer than 60 min) (n = 12 for all) (unpublished data).
Image
Figure Caption
Acknowledgments
This image is the copyrighted work of the attributed author or publisher, and
ZFIN has permission only to display this image to its users.
Additional permissions should be obtained from the applicable author or publisher of the image.
Full text @ PLoS Biol.

