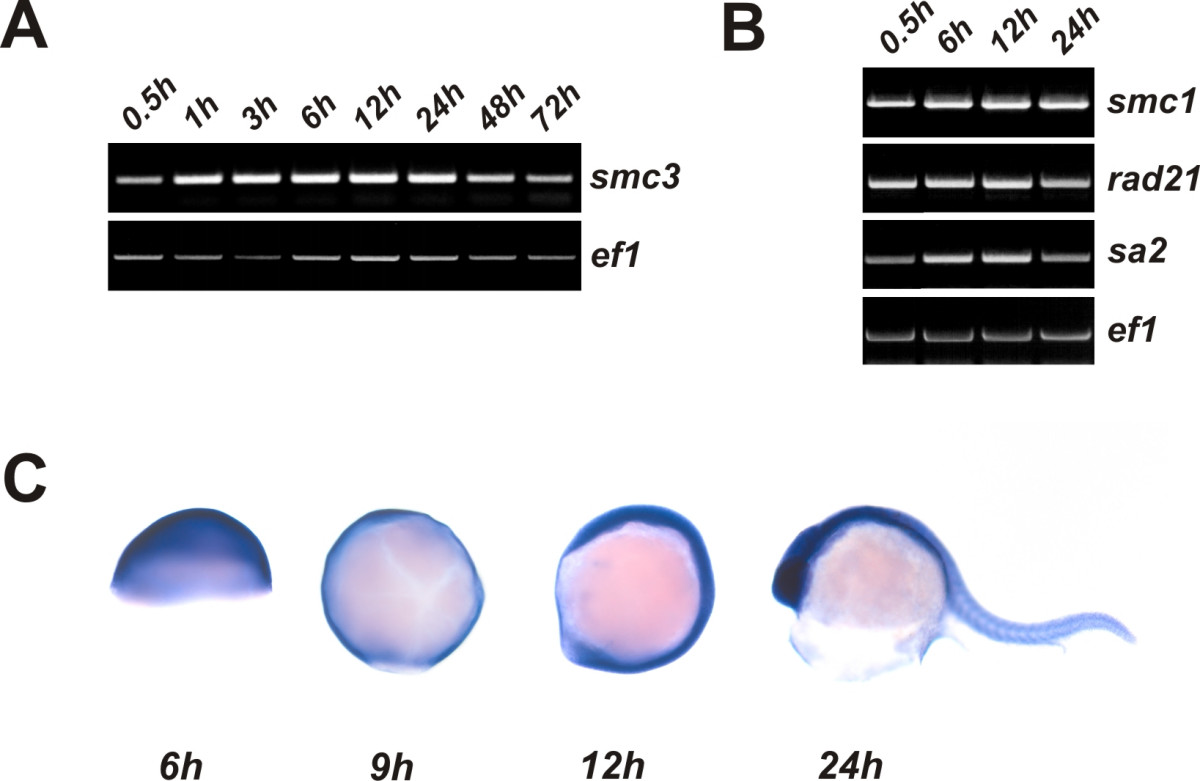
Fig. 2 Expression of zebrafish smc3 during embryogenesis. A) Semiquantitative RT-PCR analysis of smc3 transcript level in zebrafish embryos at different times during development. ef-1 transcript level, which is expressed throughout development, was used as internal control. B) Expression of constituents of the cohesin multimeric protein complex: zebrafish smc1, rad21 and sa2 transcripts were quantitated as described in panel A. C) Spatio-temporal expression of smc3 mRNA. Whole-mount mRNA in-situ hybridization was performed at the indicated developmental stages. Left-to-right: lateral view with the animal pole up of embryos at 50% epiboly (6 hpf), at 90% epiboly (9 hpf), at 3-somite stage (12 hpf), and at 24 hpf.
Image
Figure Caption
Figure Data
Acknowledgments
This image is the copyrighted work of the attributed author or publisher, and
ZFIN has permission only to display this image to its users.
Additional permissions should be obtained from the applicable author or publisher of the image.
Full text @ Mol. Cancer

