Image
Figure Caption
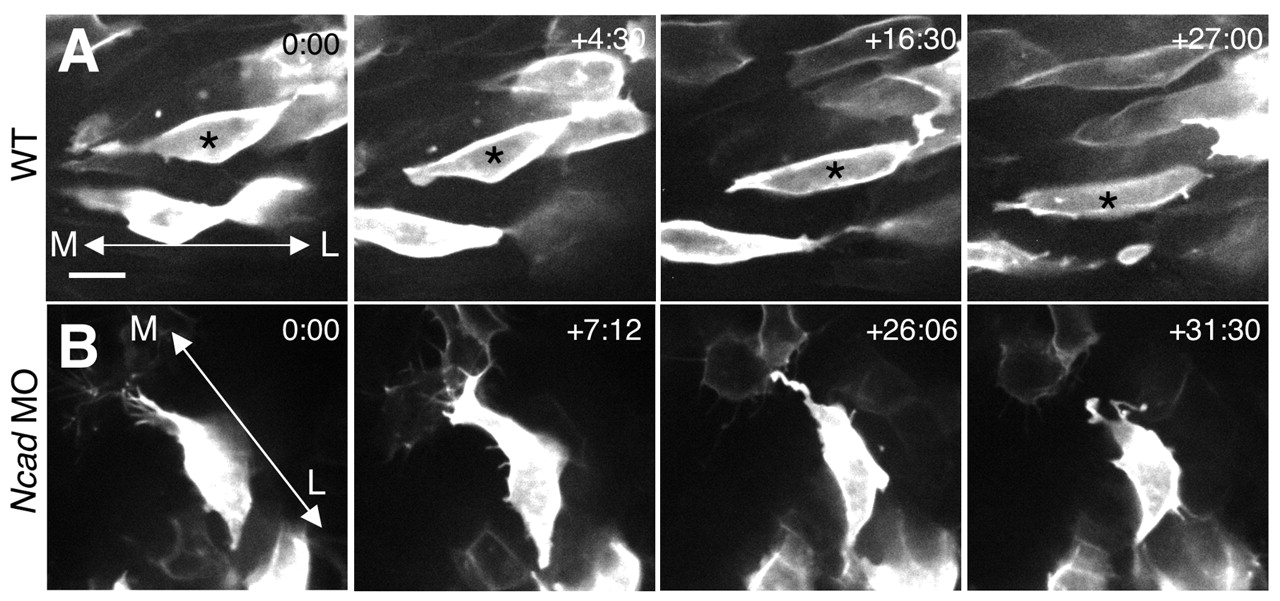
Fig. 8 The protrusive activity in N-cad-depleted embryos is unstable. (A,B) Single frames from time-lapse imaging are shown for wild-type (A) and N-cad-depleted (B) superficial cells. Time elapsed (in minutes) from the first frame is indicated in the upper right corner. mGFP-labeled embryos were imaged from a dorsal view, beginning at approximately the 3 som stage and extending through 4-5 som. Asterisks indicate individual cells identified in multiple frames; double arrowheads indicate the orientation of the mediolateral (ML) axis. Scale bar in A: 10 μm.
Acknowledgments
This image is the copyrighted work of the attributed author or publisher, and
ZFIN has permission only to display this image to its users.
Additional permissions should be obtained from the applicable author or publisher of the image.
Full text @ Development

