Image
Figure Caption
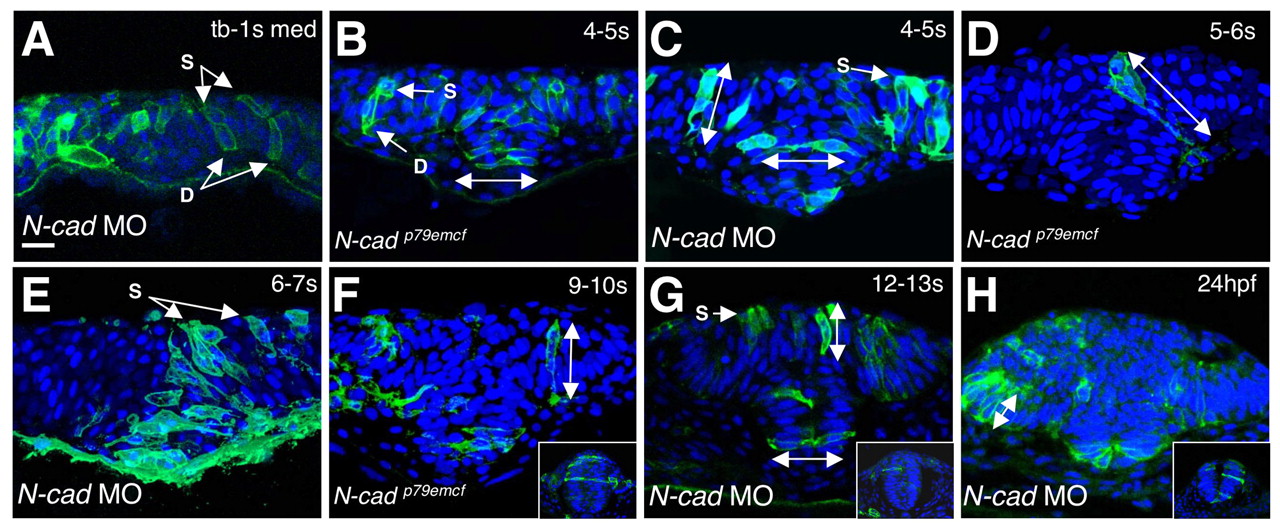
Fig. 6 Analysis of cell behaviors in N-cad-depleted embryos. (A-H) Cross sections through the anterior neuroepithelium of mGFP and DAPI-labeled MO-injected (A,C,E,G,H) and mutant (B,D,F) embryos. Dorsal is towards the top in all panels; developmental stages are indicated in the upper right corner. C,D and E are composites of multiple focal planes. All other panels are single frames. The insets in F-H are images of wild-type embryos at comparable stages. Abbreviations and symbols are as in Fig. 1. Scale bar: 20 μm.
Acknowledgments
This image is the copyrighted work of the attributed author or publisher, and
ZFIN has permission only to display this image to its users.
Additional permissions should be obtained from the applicable author or publisher of the image.
Full text @ Development

