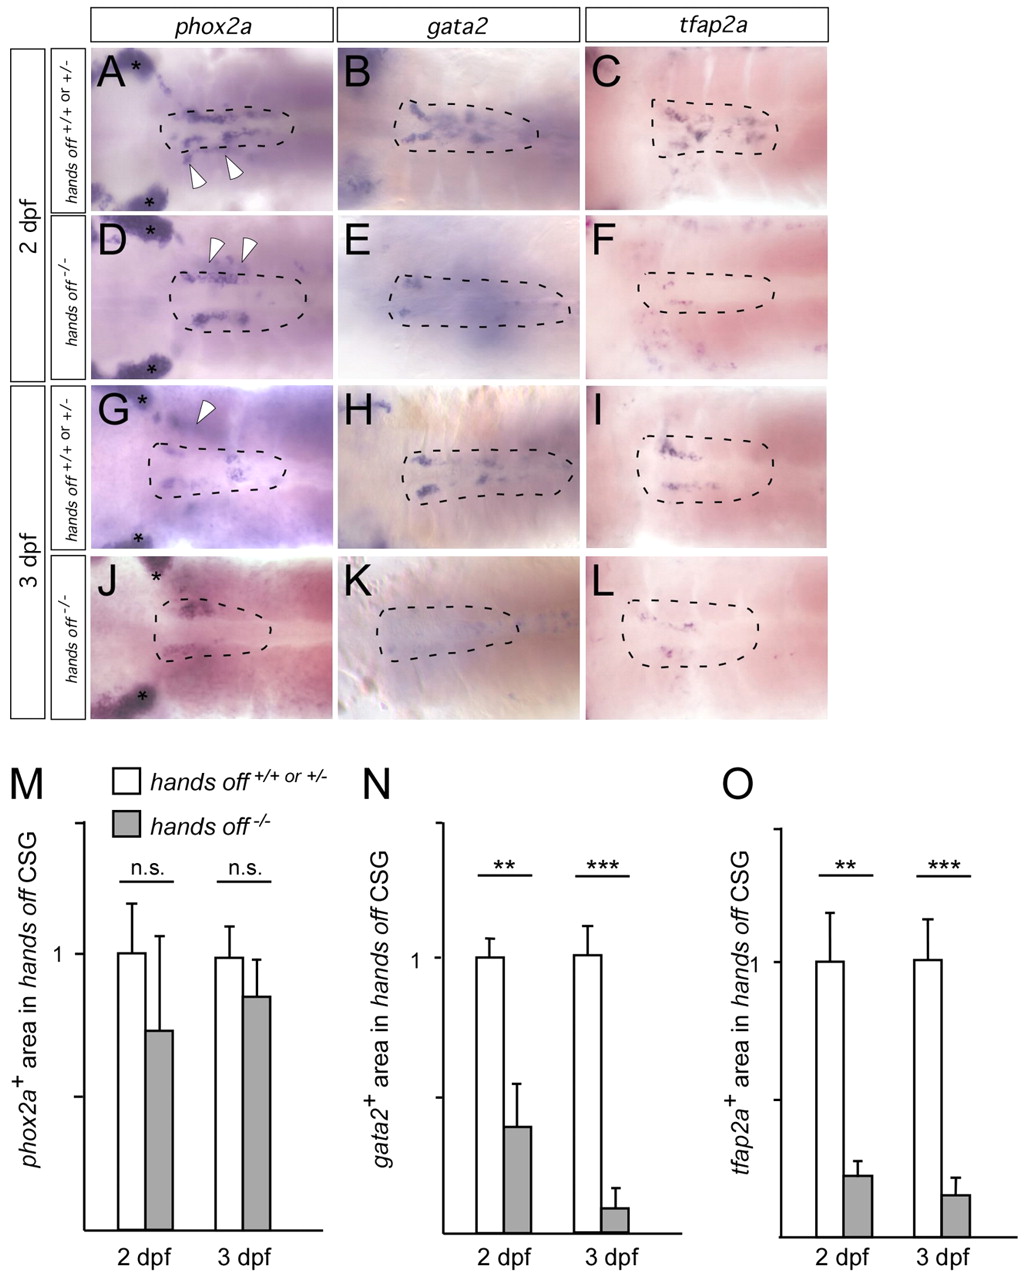
Fig. 5 phox2a, gata2 and tfap2a expression in cervical sympathetic ganglia of wild type and hands off mutants. Whole-mount in situ hybridizations viewed from dorsal. (A,D,G,J) phox2a-labeled sympathetic ganglia (dashed circle) and enteric neurons (white arrowheads). Control and hands off embryos show the same expression of phox2a at 2 dpf (A,D) and 3 dpf (G,J). gata2 expression is strongly reduced in hands off embryos (E,K) compared with wild-type embryos (B,H). tfap2a expression is massively reduced in hands off embryos (F,L) compared with wild type (C,I). (M) Area of phox2a-expressing cells at 2 and 3 dpf in hands off mutants compared with wild type. (Number of embryos analysed: seven wild type, three mutant for 2 dpf; ten wild type, five mutant for 3 dpf.) (N) Area of gata2-expressing cells at 2 and 3 dpf in hands off mutants compared with wild type. (Number of embryos analysed: six wild type, five mutant for 2 dpf; 12 wild type, nine mutant for 3 dpf.) (O) Area of tfap2a-expressing cells at 2 and 3 dpf in hands off mutants compared with wild type. (Number of embryos analysed: five wild type, 14 mutant for 2 dpf; 15 wild type, four mutant for 3 dpf.) Data are presented as mean ± s.e.m.; n.s. not significantly different (**P<0.01, ***P<0.001). Phox2a staining of epibranchial placodes is indicated by asterisks.
Image
Figure Caption
Figure Data
Acknowledgments
This image is the copyrighted work of the attributed author or publisher, and
ZFIN has permission only to display this image to its users.
Additional permissions should be obtained from the applicable author or publisher of the image.
Full text @ Development

