
|
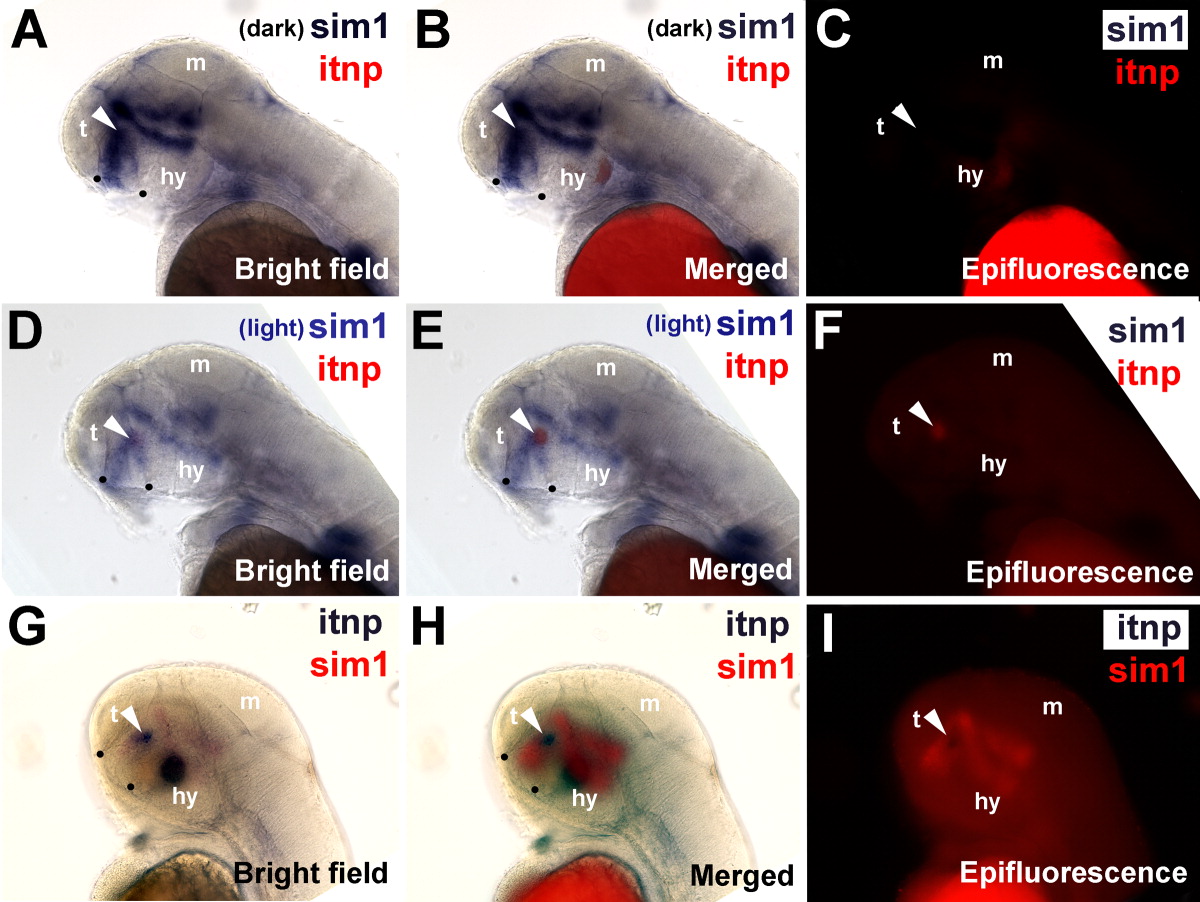
Fig. 3 Isotocin cells are located within the sim1 expression domain. Coexpression of sim1 and itnp mRNA was determined by double label in situ hybridization histochemistry (ISHH) in 48-hpf embryos. Dorsal is up and anterior to the left. A, D, G: Bright-field images. C, F, I: The corresponding epifluorescence images. B, E, H: The respective bright field and epifluorescence images merged. A-F: sim1 expression is visualized with purple staining and itnp expression is visualized with red staining (indicated by the white arrowhead). A-C: sim1 is darkly stained, quenching the red itnp staining. D-F: sim1 is lightly stained, revealing the red itnp staining. G-I: The chromogenic staining is reversed such that sim1 expression is visualized with red staining and itnp expression is visualized with purple staining. The locations of the anterior commissure and the post-optic commissure are indicted with black dots. t, telencephalon; m, midbrain; hy, hypothalamus.