Fig. 1
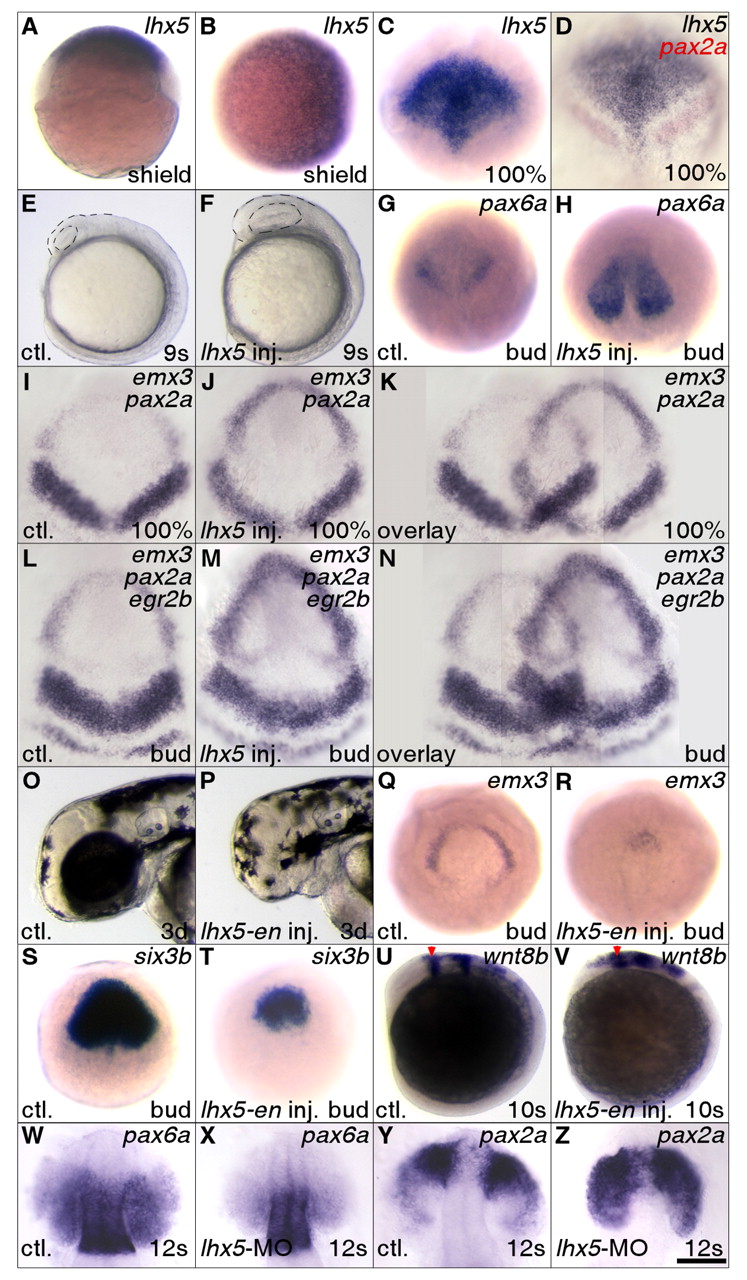
Fig. 1 Lhx5 promotes forebrain development. In this and subsequent figures, the probes used for whole-mount in situ hybridization are listed in the upper right corner of each panel. Genotypes or experimental manipulations are indicated in the lower left corners. Developmental stages are indicated in the lower right corners. Unless otherwise noted, gastrula stage embryos are orientated in animal pole view, rostral to the top; post-gastrulation stage embryos in lateral view, rostral to the top and dorsal to the right. ctl, control embryos. (A-D) lhx5 is expressed in rostral regions during embryonic development. (A,B) Dorsal to the right, lateral (A) and animal pole (B) views. (D) A gap can be seen between the lhx5 and pax2a expression domains. (E-N) lhx5 gain of function causes expansion of the forebrain. (E,F) Forebrain boundaries are marked by broken lines. (G,H) Dorsal view, bud stage, pax6a expression. (I-N) Dorsal view, rostral to the top. Embryos were dissected and flat mounted in glycerol after in situ hybridization. Partial overlays of panels were made with PhotoShop (Adobe) and brightness in the overlapped regions was adjusted so that the backgrounds match. (O-V) Inhibition of Lhx5 function compromises forebrain development. (U,V) Red arrowheads mark the forebrain-midbrain boundary. (W-Z) lhx5 morpholino knockdown alters pax6a and pax2a expression. Embryos were dissected and flat mounted in glycerol after in situ hybridization. Dorsal view, rostral to the top. Scale bar in Z: 250 μm for A-H,Q-V; 200 μm for I-K; 167 μm for L-N; 150 μm for O,P; 100 μm for W-Z.

