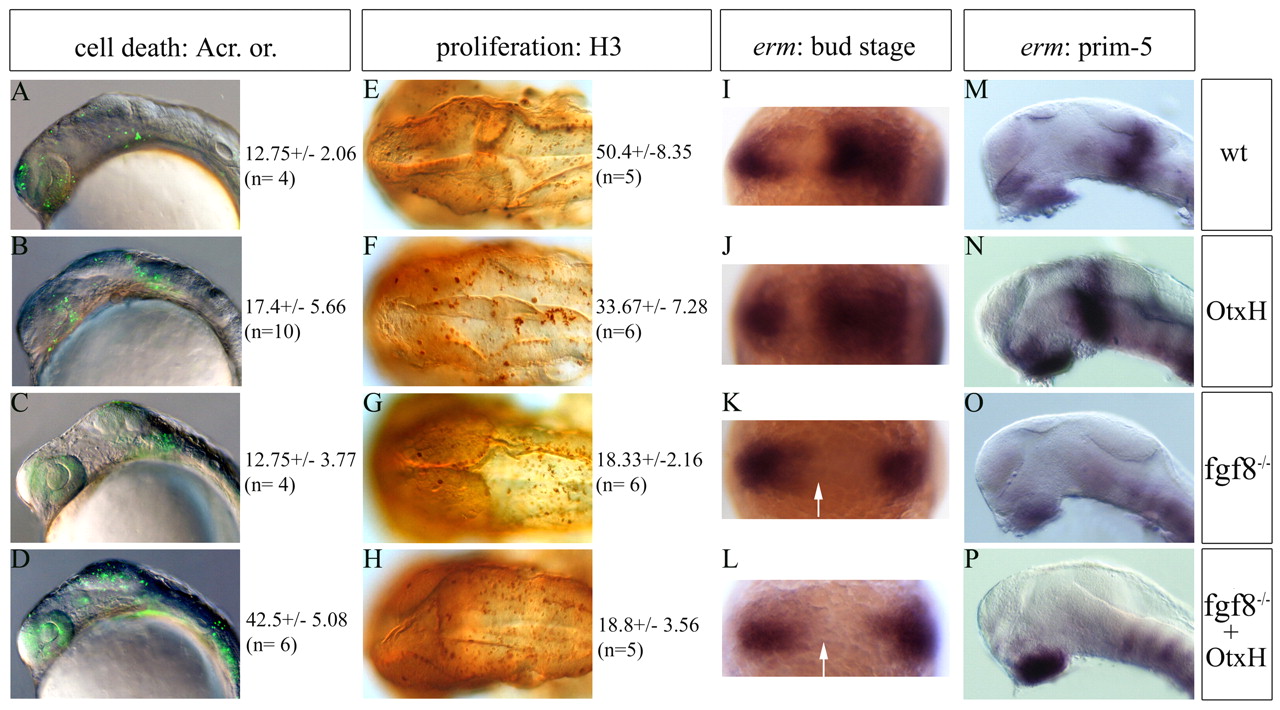
Fig. 6 fgf8-/-; OtxH embryos have a total lack of Fgf activity and show both a proliferation decrease and a cell death increase. (A-D) Lateral view of 20-somite stage live embryos stained with Acridine Orange and cell quantification (n, numbers of quantified embryos). No change in cell death is observed in fgf8-/- mutant embryos (compare A with C), while OtxH shows an increase in dying cells (B), which is enhanced in fgf8-/-; OtxH (D). These differences are more drastic at prim-22 stage (wild type: 18±4, n=3; OtxH 26±2, n=3; fgf8-/-: 12±2, n=3; fgf8-/-; OtxH: 44.33±6.03, n=3). (E-H) Dorsal views of prim-22 stage posterior brain immunostained with the H3 reveal a decrease in proliferation rate in fgf8-/- mutant (G), while lack of Otx in this context does not worsen the phenotype (H), see also quantifications. (I-P) erm expression pattern in the mid/hindbrain region of the genetic context studied at bud stage (dorsal view, I-L) and at prim-5 stage (lateral view, M-P). This Fgf transcriptional target is never induced in the presumptive mes/met (arrow) in fgf8-/- (K,O) or fgf8-/-; OtxH (L,P) embryos.
Image
Figure Caption
Figure Data
Acknowledgments
This image is the copyrighted work of the attributed author or publisher, and
ZFIN has permission only to display this image to its users.
Additional permissions should be obtained from the applicable author or publisher of the image.
Full text @ Development

