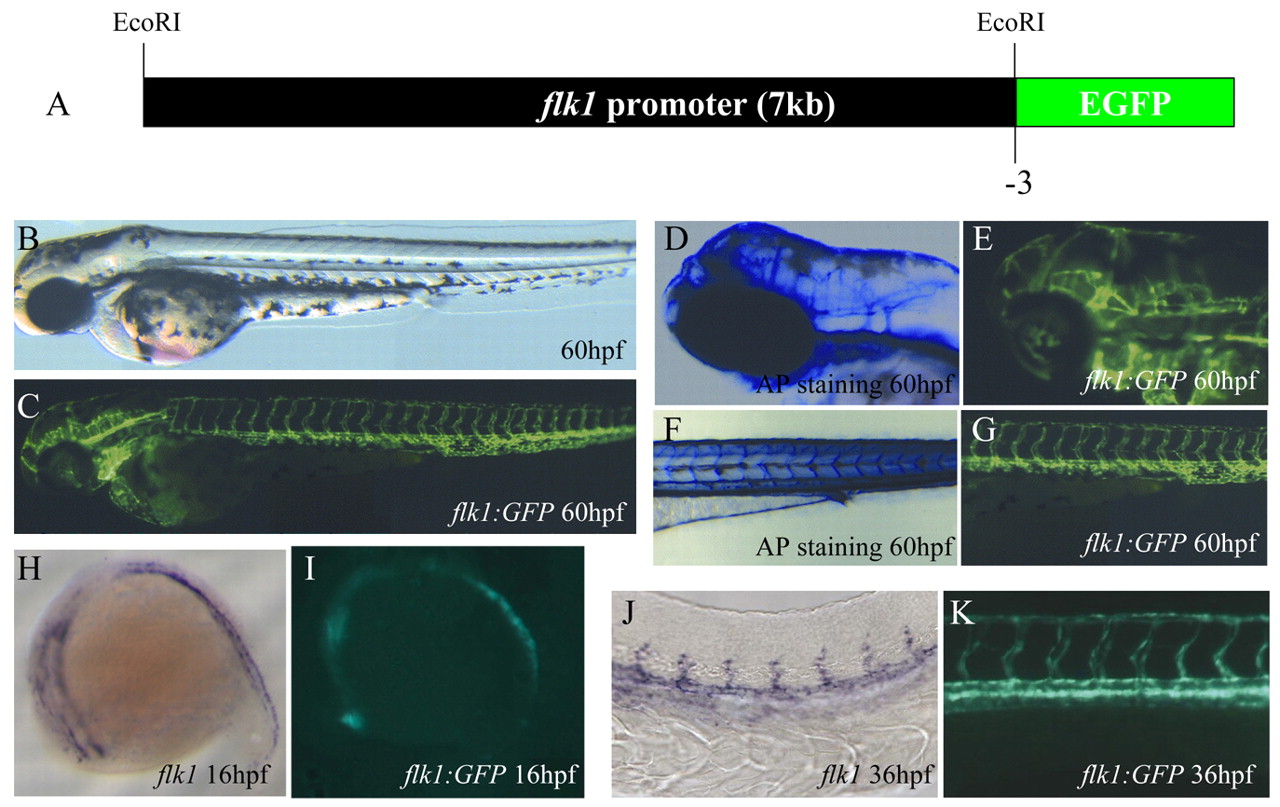
Fig. 1 Generation of the Tg(flk1:EGFP)s843 line. (A) A 6.5 kb upstream sequence of zebrafish flk1 was used to generate the Tg(flk1:EGFP)s843 line. (B) Bright-field micrograph of a 60 hpf Tg(flk1:EGFP)s843 embryo. (C) Epifluorescence micrograph of the same embryo. (D) Head vasculature of a 60 hpf embryo visualized by endogenous alkaline phosphatase (AP) activity. (E) Similar area in a Tg(flk1:EGFP)s843 embryo. (F) Trunk vasculature of a 60 hpf embryo visualized by endogenous AP activity. (G) Similar area in a Tg(flk1:EGFP)s843 embryo. (H) flk1 expression at 16 hpf in a 16 hpf embryo. (I) Expression of GFP at the same stage. (J) flk1 expression at 36 hpf in a 36 hpf embryo. (K) Expression of GFP at the same stage. The flk1:EGFP transgene recapitulates flk1 expression and allows higher resolution analyses than staining for flk1 expression or AP activity.
Image
Figure Caption
Figure Data
Acknowledgments
This image is the copyrighted work of the attributed author or publisher, and
ZFIN has permission only to display this image to its users.
Additional permissions should be obtained from the applicable author or publisher of the image.
Full text @ Development

