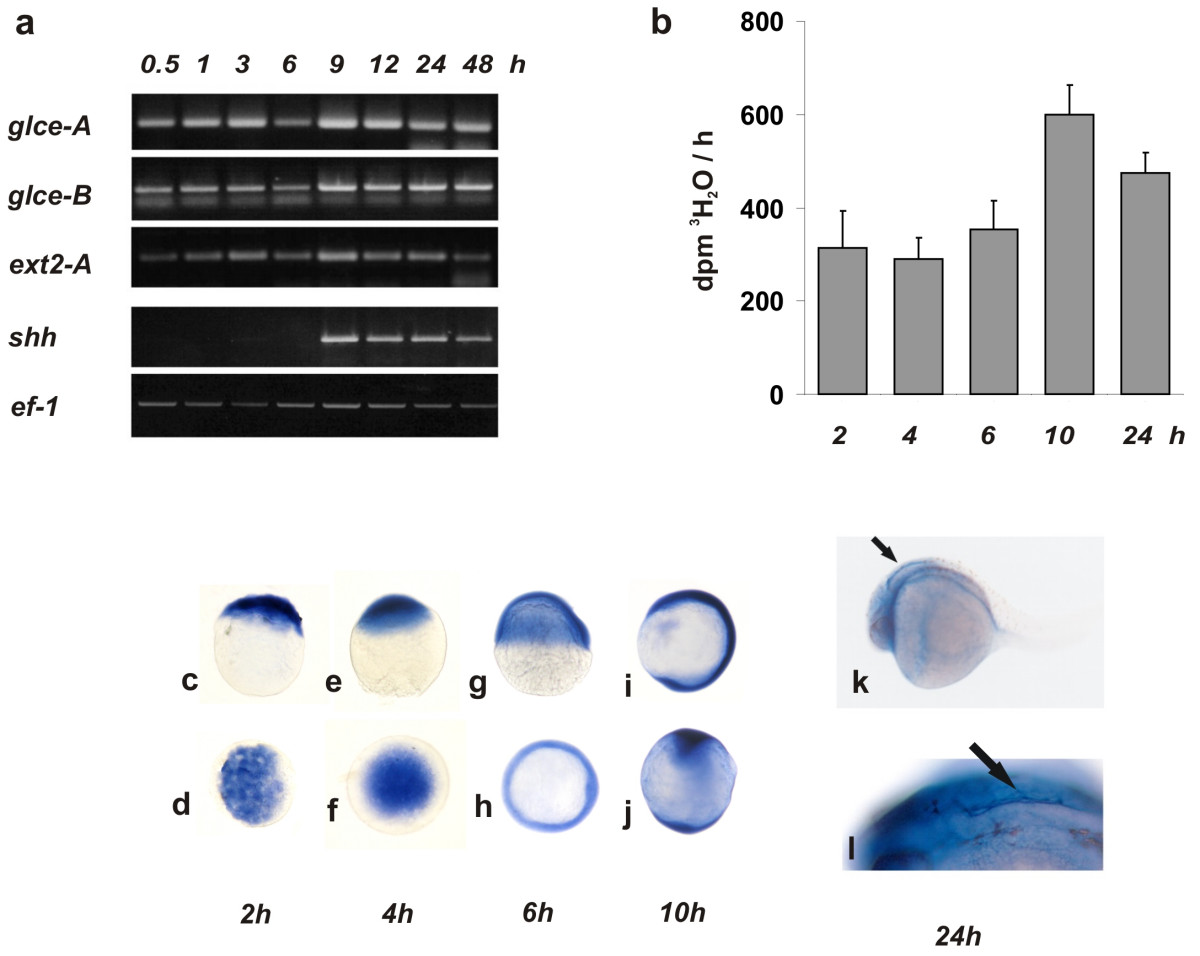
Fig. 2 glce mRNA expression pattern in developing embryos. (a) RT-PCR analysis of the transcript level. Thirty embryos were collected in Tri-Reagent at different developmental stages as indicated. cDNA was generated from total RNA (1 µg) using Sensiscript reverse transcriptase primed with oligo-dT at 37°C for 2 h. PCR reactions (25 cycles) were performed in duplicate and analyzed on 1% agarose gel. (b) Glce enzymatic activity in embryos at different developmental stage. At each time point 20 embryos were dechorionated and homogenized. For the enzymatic assay, a cell lysate was incubated (2 h at 28°C) with labeled bacterial K5 heparosan substrate and the 3H2O liberated as result of the epimerization of GlcA into IdoA, measured. The bars represent the mean ± SD of the values from three independent determinations. (c-l) whole-mount in-situ hybridization of glce-a in embryos at different stages of development. (c-j) Top row: lateral views. Bottom row: animal pole views. (c,d) blastoderm at 64 cells stage; (e,f) dome stage; (g,h) shield stage; (i,j) 3 somite stage. (k) 24 hpf embryo showing showing intense glce staining at the perimeter of the forth ventricle as indicated by the arrow-heads. (l) enlargment of the embryo brain forth ventricle area.
Image
Figure Caption
Figure Data
Acknowledgments
This image is the copyrighted work of the attributed author or publisher, and
ZFIN has permission only to display this image to its users.
Additional permissions should be obtained from the applicable author or publisher of the image.
Full text @ BMC Dev. Biol.

