
- Title
-
Involvement of Oxidative and Endoplasmic Reticulum Stress in RDH12-Related Retinopathies
- Authors
- Sarkar, H., Toms, M., Moosajee, M.
- Source
- Full text @ Int. J. Mol. Sci.

Generation of HEK-293 stable cell line expressing wildtype and mutant RDH12. (A) Western blot analysis of HEK-293 cells transfected with GFP-tagged RDH12. p.Y226C and p.S13* cell lines show no RDH12 protein expression, while p.A109P shows reduced expression. (B) Co-staining of calnexin (red) and GFP (green) confirmed localisation of RDH12 to the endoplasmic reticulum. Nuclei were counterstained with DAPI (4′,6-diamidino-2-phenylindole) (blue). Scale bar = 10 µM. (C) RDH12 activity assay using HPLC showed no atROL was detected in untransfected cells, but it was found in WT cells, confirming active functional RDH12. (D) Enzyme activity of all mutant proteins was significantly reduced compared with WT RDH12. (E) RDH12 protects against atRAL-induced toxicity. Cells were dosed with increasing concentrations of atRAL for 24 h and cell viability was assessed by MTT assay. atRAL is toxic to untransfected cells, whereas cells expressing WT RDH12 were protected from atRAL-induced cell death. p.Y226C and p.S13* mutant RDH12 did not protect cells from atRAL toxicity, whereas p.A109P mutant protein offered significantly higher protection than untransfected cells at 100 µM atRAL concentration. Three independent experiments were performed. Data are expressed as mean ± SEM, and analysed using two-way ANOVA, followed by Dunnetts multiple comparison test. * p ≤ 0.05, *** p ≤ 0.001. |

RDH12 protects cells from atRAL-induced oxidative stress. (A) Dosing untransfected cells with 50 µM atRAL for 24 h causes a significant reduction in SOD activity, indicating an increase in oxidative stress. Cell expressing WT RDH12 are protected from atRAL-induced oxidative stress. Dosing with atRAL causes a significant reduction in SOD activity in mutant cells. Statistical significance was analysed using two-way ANOVA and Sidak’s multiple comparison test. ** p ≤ 0.01, *** p ≤ 0.001. (B) Expression of oxidative stress markers NRF2, SOD2, CAT, GPX1, and HO-1 was analysed by RT-qPCR following treatment with 50 µM atRAL for 24 h. Statistical significance was analysed with paired t-test. * p ≤ 0.05, ** p ≤ 0.01, *** p ≤ 0.001. |
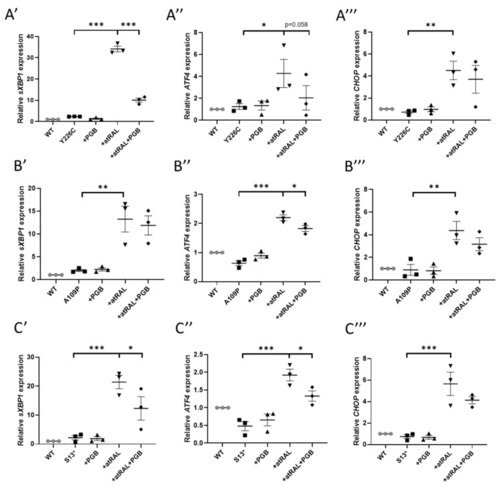
atRAL-induced ER stress was attenuated by pregabalin. Cells were dosed with 50 µM atRAL, 1 mM pregabalin (PGB), or both for 24 h. RT-qPCR was performed analysing the expres-sion of ER stress markers. Dosing with atRAL significantly increased expression of sXBP1 (A′, B′, C′), ATF4 (A″, B″, C″), and CHOP (A‴, B‴, C‴) in p.Y226C (A), p.A109P (B), and p.S13 (C) cell lines. Dosing with pregabalin reduced expression of ER stress markers. Statistical significance was analysed using one-way ANOVA and Sidak’s multiple comparison test. * p ≤ 0.05, ** p ≤ 0.01, *** p ≤ 0.001. |
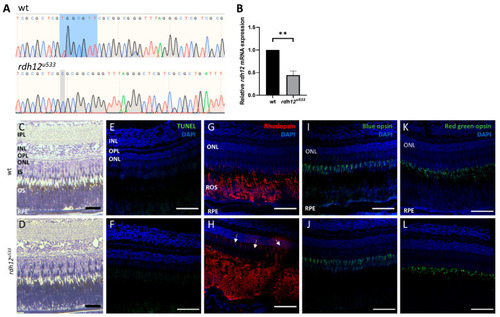
Generation and characterisation of rdh12u533 mutant zebrafish. (A) Sanger sequencing traces showed a 7 bp deletion (c.17_23del) in the rdh12u533 mutant fish. The deleted bases are highlighted in blue on the wildtype trace. (B) RT-qPCR showed a significant reduction of rdh12 mRNA expression in the rdh12u533 fish at 5 dpf (** p ≤ 0.001 analysed by paired t-test). (C,D) Retinal sections from 12 mpf fish were stained with toluidine blue to assess retinal structure. (E,F) TUNEL assay revealed no cell death Immunohistochemistry staining was used to detect rhodopsin (red) (G,H), blue opsin (green) (I,J), and red/green opsin (green) (K,L). Sections were counterstained with DAPI (blue). Rhodopsin mislocalisation was observed in rdh12u533 fish. Scale bar = 50 µM. IPL, inner plexiform layer; INL, inner nuclear layer; OPL, outer plexiform layer; ONL, outer nuclear layer; IS, inner segment; OS, outer segment; RPE, retinal pigment epithelium. |

Retinal ultrastructure of wt and rdh12u533 mutant fish. Transmission electron microscopy was used to assess retinal ultrastructure of wt (A,C) and rdh12u533 (B,D) fish at 12 mpf. Phagosomes are indicated with white asterisks. Scale bar = 50 µm. (E) No significant difference was noted in the number of phagosomes between wt and rdh12u533 fish. (F) Phagosomes were significantly larger in the rdh12u533 fish at 12 mpf. Data are displayed as mean ± SEM. Phagosome number and size was quantified using ImageJ from three wt and rdh12u533 fish. Statistical significance was analysed by Mann–Whitney, *** p ≤ 0.001. (G) mRNA expression of autophagy genes in the retina of 12 mpf fish was analysed by RT-qPCR. Expression of atg12 was significantly reduced in the rdh12u533 fish. * p ≤ 0.05. OS, outer segment; RPE, retinal pigment epithelium; BM, Bruch’s membrane. |

Analysis of oxidative stress in adult rdh12u533 zebrafish retina. (A) atRAL levels in 16 mpf retina were analysed by HPLC. Activity of antioxidant enzymes SOD (B) and CAT (C) was analysed in 16 mpf retina, but no significant differences were found between wt and rdh12u533 mutant fish. (D–I) Expression of oxidative stress markers was analysed by RT-qPCR in retinas from wt and rdh12u533 fish at 12 mpf. mRNA expression of sod2 was significantly reduced in rdh12u533 fish retinas. Data are expressed as mean ± SEM; * p < 0.05. |

ZFIN is incorporating published figure images and captions as part of an ongoing project. Figures from some publications have not yet been curated, or are not available for display because of copyright restrictions. |