
- Title
-
Cysteamine-bicalutamide combination therapy corrects proximal tubule phenotype in cystinosis
- Authors
- Jamalpoor, A., van Gelder, C.A., Yousef Yengej, F.A., Zaal, E.A., Berlingerio, S.P., Veys, K.R., Pou Casellas, C., Voskuil, K., Essa, K., Ammerlaan, C.M., Rega, L.R., van der Welle, R.E., Lilien, M.R., Rookmaaker, M.B., Clevers, H., Klumperman, J., Levtchenko, E., Berkers, C.R., Verhaar, M.C., Altelaar, M., Masereeuw, R., Janssen, M.J.
- Source
- Full text @ EMBO Mol. Med.

Cell viability curves of dimethyl α‐ketoglutarate (DMKG) in Cell viability curves of the increasing concentration of DMKG in control ( Cell viability test in Data information: Data are expressed as mean ± SEM. |

Metabolomic analysis of CRISPR‐generated cystinotic cells ( Heat map analysis of the measured metabolites in Heat map and REACTOME analysis of the altered proteins in Proteomic analysis of Data information: Data are expressed as mean ± SEM. |

Volcano plot illustrates significantly differentially abundant proteins ( Western blotting and densitometric analyses for LC3‐II/LC3‐I ratio in CRISPR‐generated Quantification of TFEB‐GFP nuclear translocation in Data information: Data are expressed as mean ± SEM. * |

Principal component analysis (PCA) of control ( Heat map analysis of top 25 metabolites distinctively expressed in control and Global test pathway enrichment analysis of the intracellular metabolic interactions distinctively affected in List of metabolites that were shared and significantly altered in both the Plasma levels of αKG (µM) in healthy individuals ( Principal component analysis (PCA) of the measured proteins in Volcano plot illustrates differentially abundant proteins ( Gene ontology (GO) analysis illustrates classes of proteins differing between List of proteins that were significantly upregulated and downregulated in Data information: Data are expressed as mean ± SEM. * |
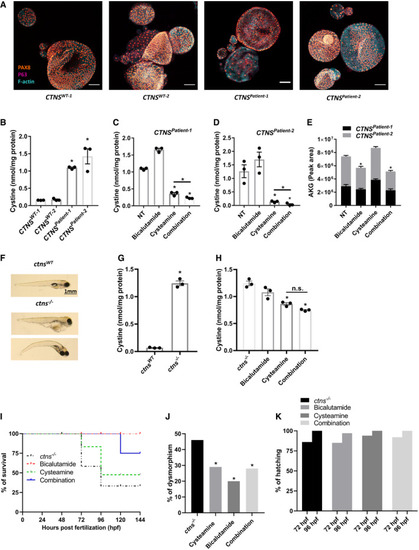
Immunocytochemistry of patient‐derived cystinotic tubuloids ( Quantification of cystine levels (nmol/mg protein) by HPLC‐MS/MS in control and cystinotic tubuloids ( Quantification of cystine levels (nmol/mg protein) by HPLC‐MS/MS in two different patient‐derived cystinotic tubuloids in the absence of the drugs (NT) or upon treatment with cysteamine (100 μM), bicalutamide (35 μM) or cysteamine (100 μM)‐bicalutamide (35 μM) combination treatment ( αKG levels measured in patient‐derived cystinotic tubuloids ( Representative images of control and cystinotic zebrafish. Quantification of cystine levels (nmol/mg protein) by HPLC‐MS/MS in control and cystinotic zebrafish ( Quantification of cystine levels (nmol/mg protein) by HPLC‐MS/MS in cystinotic zebrafish after treatment with cysteamine (1,000 µM), bicalutamide (10 µM), and a combination of cysteamine and bicalutamide (1,000 and 10 µM, respectively) ( Survival rates in Deformity rates in Hatching rates in surviving Data information: Data are expressed as mean ± SEM. * |
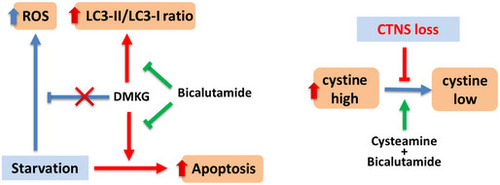
The blue arrows indicate wild‐type situation, red arrows/text indicate the changes in cystinotic cells, and green arrows indicate intervention with medication. DMKG: dimethyl α‐ketoglutarate, ROS: Reactive oxygen species. |

Schematic overview of the CRISPR‐based strategy to knockout the Sanger sequencing chromatogram shows resulting sequence in CRISPR‐generated cystinotic cells ( Quantification of cystine levels (nmol/mg protein) by HPLC‐MS/MS in control ( Quantification of cystine levels (nmol/mg protein) by HPLC‐MS/MS in Data information: Data are expressed as mean ± SEM. * |

Representative immunofluorescent staining of |
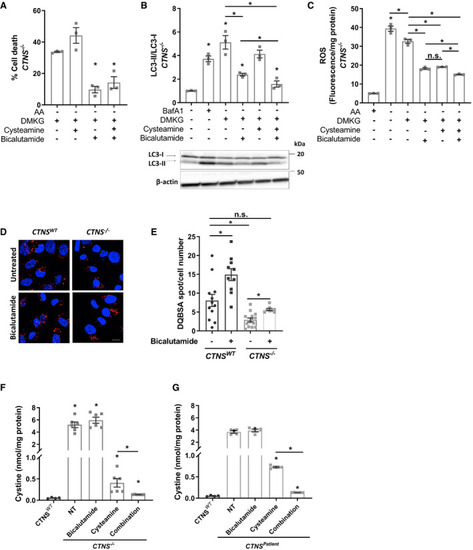
Cell viability test of DMKG (2 mM)‐treated CRISPR‐generated cystinotic cells ( Western blotting and densitometric analyses for LC3‐II/LC3‐I ratio in DMKG (2 mM)‐treated Relative reactive oxygen species (ROS/mg protein) production in DMKG‐treated Representative confocal micrographs and quantification of DQ‐BSA in Quantification of cystine levels (nmol/mg protein) by HPLC‐MS/MS in Quantification of cystine levels (nmol/mg protein) by HPLC‐MS/MS in Data information: Data are expressed as mean ± SEM. * |

Patient‐derived cystinotic tubuloids ( Brightfield images of cystinotic tubuloids and healthy control tubuloids at the start of treatment and after 5 days of cysteamine (100 μM)‐bicalutamide (35 μM) combination treatment or treatment with medium only (negative control). Scale bars are 2,000 µm. Bicalutamide safety screening in cystinotic tubuloids. Tubuloid viability upon treatment with cysteamine (100 μM) in combination with increasing concentrations of bicalutamide was compared to treatment with cysteamine alone (= 100% viability) (per donor Survival rates in wild‐type zebrafish upon treatment with bicalutamide (10 µM), and a combination of cysteamine and bicalutamide (1,000 and 10 µM, respectively) ( Deformity rates in wild‐type zebrafish upon treatment with bicalutamide (10 µM), and a combination of cysteamine and bicalutamide (1,000 and 10 µM, respectively) ( Hatching rates in surviving wild‐type zebrafish evaluated at 72‐ and 96‐h post‐fertilization (hpf) with bicalutamide (10 µM), and a combination of cysteamine and bicalutamide (1,000 and 10 µM, respectively) ( Data information: Data are expressed as mean ± SEM. |

Relative reactive oxygen species (ROS/mg protein) production in control ( ROS production (ROS/mg protein) in Viability test in starved (−AA) Representative confocal micrographs (scale bars are 20 µm) and immunofluorescence analysis of caspase 3/7 activation in DMKG (2 mM)‐treated Western blotting and densitometric analyses for LC3‐II/LC3‐I ratio in Data information: Data are expressed as mean ± SEM. |
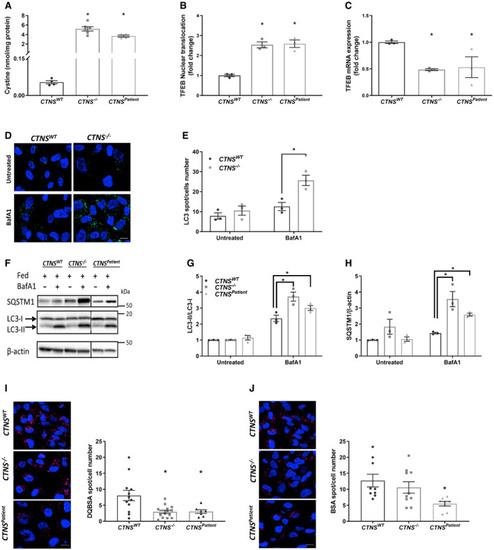
Quantification of cystine levels (nmol/mg protein) in control ( Quantification of transcription factor EB (TFEB)‐GFP nuclear translocation in Representative confocal micrographs and quantification of LC3‐II accumulation in Western blotting and densitometric analyses for LC3‐II/LC3‐I ratio and SQSTM1 protein levels in Representative confocal micrographs and quantification of DQ‐BSA and BSA in Data information: Data are expressed as mean ± SEM. * |