
FIGURE
FIGURE 3
- ID
- ZDB-FIG-220824-25
- Publication
- Tang et al., 2022 - Comparative Study of the Molecular Characterization, Evolution, and Structure Modeling of Digestive Lipase Genes Reveals the Different Evolutionary Selection Between Mammals and Fishes
- Other Figures
- All Figure Page
- Back to All Figure Page
FIGURE 3
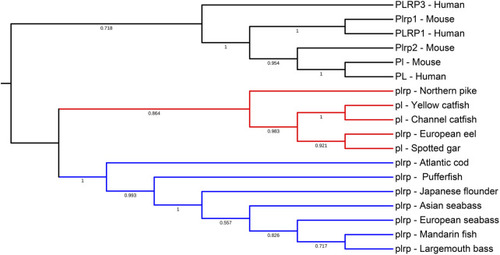
Phylogenetic relationship of pancreatic lipase genes in mammals and fishes with based on the ML method. The bootstrap test (1000 replicates) scores are shown with numbers. The blackline represents the group of |
Expression Data
Expression Detail
Antibody Labeling
Phenotype Data
Phenotype Detail
Acknowledgments
This image is the copyrighted work of the attributed author or publisher, and
ZFIN has permission only to display this image to its users.
Additional permissions should be obtained from the applicable author or publisher of the image.
Full text @ Front Genet