
Figure 3—figure supplement 1
- ID
- ZDB-FIG-211224-21
- Publication
- Choi et al., 2021 - Specialized neurons in the right habenula mediate response to aversive olfactory cues
- Other Figures
-
- Figure 1
- Figure 1—figure supplement 1.
- Figure 1—figure supplement 2—source data 1.
- Figure 1—figure supplement 3.
- Figure 2
- Figure 3
- Figure 3—figure supplement 1
- Figure 3—figure supplement 2.
- Figure 3—figure supplement 3
- Figure 3—figure supplement 4.
- Figure 4
- Figure 4—figure supplement 1
- Figure 5
- Figure 5—figure supplement 1
- All Figure Page
- Back to All Figure Page
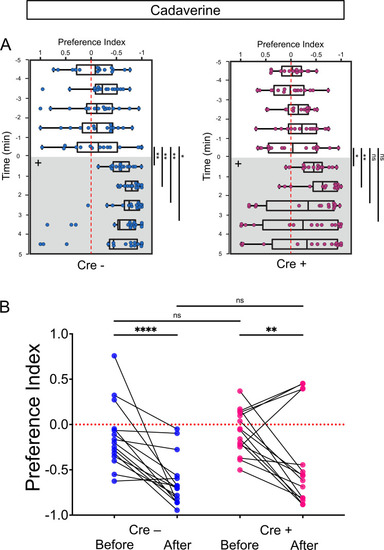
Preferred tank location prior to and after cadaverine addition within each group and between groups. (A) Preferred tank location prior to and after cadaverine addition of adults genotyped for absence (Cre-, blue) or presence (Cre+, red) of Tg(slc5a7a:Cre). Preference index for all adults tested 5 min prior to (white) and 5 min after addition of cadaverine (grey and on side indicated by +). In Cre- fish, significant differences in repulsive behavior were detected after addition of cadaverine [6 min (p = 0.0084), 7 min (p = 0.0012), 8 min (p = 0.0017), 9 min (p = 0.0353) compared to the last min before addition, Wilcoxon signed-rank test, n = 15 fish]. Cre+ fish, did not show significant differences in their preferred location beyond two mins after cadaverine addition [6 min (p = 0.0302), 7 min (p = 0.0043) compared to the last min before addition, Wilcoxon signed-rank test, n = 15 fish]. (B) Preference index before and after addition of cadaverine averaged over 5 min periods for without [Cre-; –0.1341 ± 0.0923 and –0.6315 ± 0.0718] or with the Cre transgene [Cre+; –0.0823 ± 0.0631 and –0.3952 ± 0.1365], n = 15 fish per group. Two-way ANOVA reveals significant effect of time [F(3, 179) = 32.45, p < 0.0001], group [F(14, 60) = 3.4887, p = 0.0004] and interaction [F(42, 180) = 4.887, p < 0.0001]. Post-hoc analysis by Bonferroni’s multiple comparisons. Dashed red lines in A and B denote midpoint of test tank. |