
Figure 4
- ID
- ZDB-FIG-210904-9
- Publication
- Ogawa et al., 2021 - Partitioning of gene expression among zebrafish photoreceptor subtypes
- Other Figures
- All Figure Page
- Back to All Figure Page
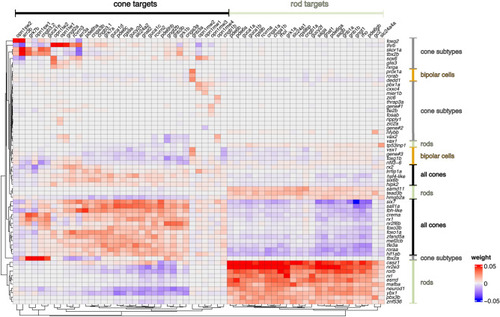
Candidate transcriptional regulators responsible for expression of phototransduction genes. Heatmap showing positive (red) and negative (blue) associations between transcriptional regulators (transcription factors and cofactors) and differentially expressed phototransduction genes (target genes) calculated by GENIE3 algorithm in SCENIC. Rows and columns are arranged according to divisive hierarchical clustering (dividing clusters in a top-down manner). The (dis)similarity of observations was calculated using Euclidean distances. Cell type expression patterns of the transcriptional regulators are presented in Fig. |