|
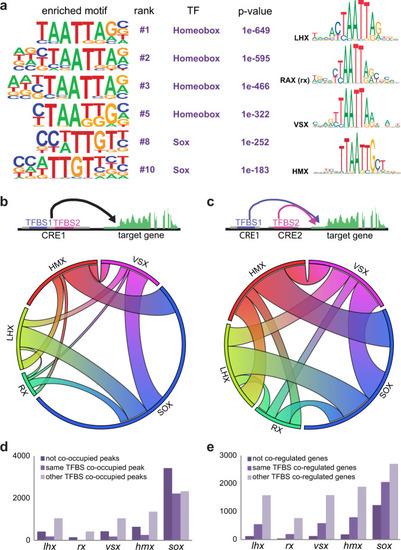
NR motif enrichment analysis.a Representative TF binding motifs enriched in NR DOCRs as identified by HOMER. The binding motif similarity among neural retina TFs of the homeobox family is indicated (http://jaspar.genereg.net). b Circoplot illustrating the co-occupancy rate of TFBS in the same DOCRs for the main TFs identified in the motif enrichment analysis. c Circoplot illustrating the degree of co-regulation between TFs regulating the same gene through different DOCRs. d Number of CREs containing the main TFs identified in the motif enrichment analysis classified according to their co-occupancy. e Number of genes associated with CREs containing the main TFs identified in the motif enrichment analysis, classified according to their co-regulation.
|