
Figure 5
- ID
- ZDB-FIG-210301-140
- Publication
- Xiong et al., 2021 - In vivo proteomic mapping through GFP-directed proximity-dependent biotin labelling in zebrafish
- Other Figures
- All Figure Page
- Back to All Figure Page
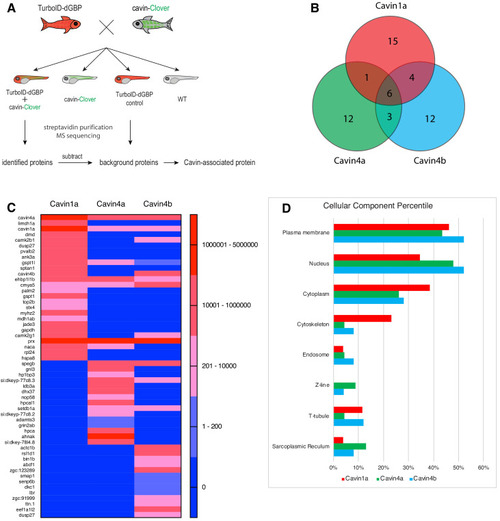
(A) A schematic overview of applying TurboID-dGBP fish to identify cavin-associated proteins. The TurboID-dGBP zebrafish was crossed with Clover-tagged cavin fish lines. The embryos carrying both transgenes were selected for subsequent biotin incubation and biotin affinity purification coupled MS sequencing. Identified proteins were refined by subtracting proteins identified in control embryos expressing only TurboID-dGBP. (B) Venn diagram showing the overlap of identified proteins in Cavin1a, Cavin4a, and Cavin4b samples. (C) Heatmap showing relative abundance of identified proteins based on normalised MS2Count in Cavin1a, Cavin4a, and Cavin4b proteomes. (D) Bar graph showing the distribution of proteins at subcellular level. The cellular component information was curated from Uniport database and literature. For table summarising all identified and enriched proteins, see Supplementary file 1 – Tables 1-3. For table annotating all identified and enriched protein with subcellular localisation and functions, see Supplementary file 1 – Table 4. For table showing all identified peptides in Cavin1a sample and sibling control sample see Supplementary file 2 – Tables 1-2. For protein identification report generated by ProteinPilot, see Figure 5—source datas 1–6. |