|
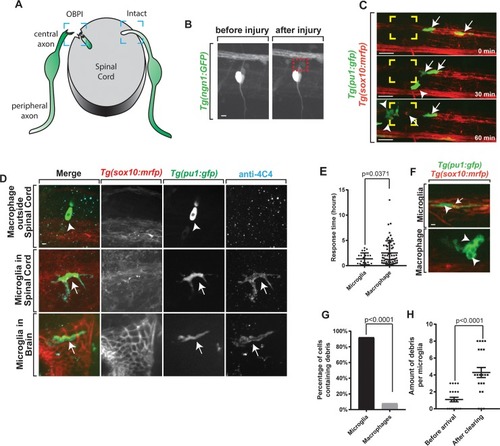
Modeling OBPI.(A) Graphical representation of OBPI model. Boxes indicate injured and intact DREZ. (B) Confocal z-projection of Tg(ngn1:gfp) zebrafish at 4 dpf showing successful spinal root avulsion. (C) Representative images from 24-hour time-lapse movies starting at 4 dpf in Tg(pu1:gfp);Tg(sox10:mrfp) zebrafish showing the arrival of both microglia and macrophages to the injury site. Arrows indicate microglia. Arrowheads indicate macrophages. Yellow box indicates injury site. (D) Confocal z-projection of Tg(pu1:gfp);Tg(sox10:mrfp) stained with the microglia-specific anti-4C4 antibody showing the presence of microglia in the brain and spinal cord and lack of 4C4 staining in macrophages outside the brain and spinal cord. Arrows indicate microglia. Arrowheads indicate macrophages. (E) Quantification of individual cell response time to site of injury. (F) Images from a 24-hour time-lapse movie starting at 4 dpf in Tg(pu1:gfp);Tg(sox10:mrfp) zebrafish showing debris and vacuoles in phagocytic cells. Arrows indicate mRFP+ debris from sox10 cells. Arrowheads indicate vacuoles. (G) Quantification of the percentage of microglia and macrophages that contain debris (p < 0.0001). (H) Quantification of amount of individual debris puncta within microglia before and after arrival to injury site. Scale bar equals 1 μm (D,F), 10 μm (B,C). Statistics summarized in S1 Table. See S1 Data for raw data. DREZ, dorsal root entry zone; OBPI, obstetrical branchial plexus injury.
|